What are the Top 10 Most Valuable Companies in the World 2026?
| Which company is the world's most valuable? Apple once again leads the charge as the most valuable company in the world, ahead of Microsoft and Saudi Aramco. |

The coronavirus pandemic, which forced the closure of many of the world's largest economies, caused a crash in equity markets in March 2020, a month marked by high volatility. Despite this, the world's largest corporations were able to weather the wave of selling and gradually return to pre-Covid-19 levels.
In this article, we'll look at the most valuable companies in the world by capitalization in 2023. We will also examine how the crisis has affected them, as well as potential scenarios for the remainder of the year.
Most Valuable Companies: Pre-Context
The stock market value of the world's most valuable companies recovered early from the March 2020 collapse. So much so that, according to the PwC report 'Global Top 100 Companies by Market Capitalization', the market capitalisation of the world's 100 most valuable companies increased from 21.4 trillion dollars to 31.7 trillion dollars between that date and March 2021, a 48% increase in just one year.
The market capitalisation of the world's most valuable companies reached an all-time high of $35.16 trillion between March 2021 and March 2022.
As we enter 2023, let's take a closer look at the world's ten largest companies by market capitalization. The information below is from Investing.com as of December 21, 2022.
Top 10 Most Valuable Companies in the World 2023
APPLE (AAPL)
Apple has reclaimed the top spot on the list of the world's most valuable companies. Apple began to take off in 1997, when Steve Jobs, one of its founders who had left the company a few years before, took over as CEO. He served in this capacity until August 24, 2011.
Jobs died from cancer a few weeks later.
What Jobs accomplished with Apple was to build a massive fan base around a brand that is instantly recognizable around the world and for which its devotees are willing to pay exorbitant prices. From the 2000s to 2010, Apple's success was largely due to the iPhone and iPad.
Because of their multifunctionality, these products revolutionized technological mobility in some ways. The company's strong performance was reflected in the stock market, with Apple holding the world's largest market capitalisation between 2012 and 2017. Microsoft took this title away from Apple in 2018, while Aramco's stock market breakthrough at the end of 2019 pushed Apple into third place.
| It currently has a market capitalisation of $2.1 trillion (as of 21 December 2022). |
Let's take a closer look at Apple's technical chart to better understand its performance:
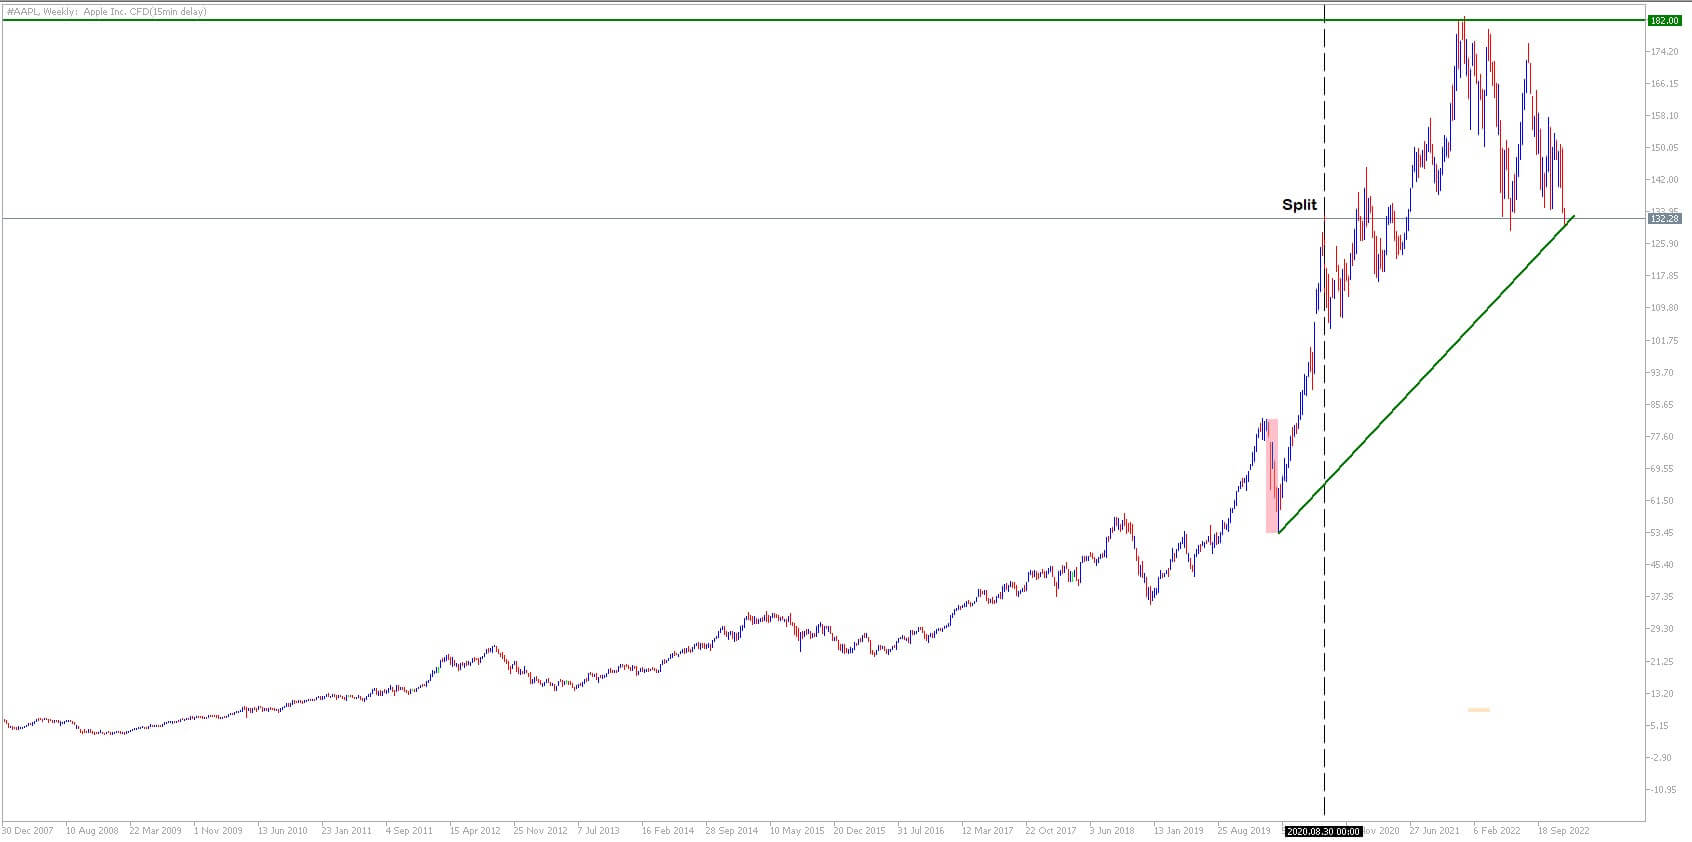
The chart depicts a consistent uptrend that became more pronounced just after the financial markets crashed in March 2020 as a result of the Covid-19 pandemic (highlighted with a pink rectangle).
Soon after that date, in late August 2020, Apple implemented a 4-for-1 stock split, making each Apple share worth $500. It began trading at $120 after a four-way split. The share price was $134 as of 21 December 2022, up from $134 in June 2021.
MICROSOFT (MSFT)
After some difficult years, particularly between 2007 and 2013, Microsoft is now the world's second most valuable company in terms of market capitalisation.
Bill Gates and Paul Allen founded Microsoft in 1975, and its primary business is the development of operating systems, software, and hardware. Microsoft is now involved in other technological areas such as artificial intelligence and video games. It is also present in social networks, such as Skype and Linkedin. This diversification of its business has increased investor confidence and made Microsoft more storm-resistant.
| Its capitalisation surpassed $1 trillion in April 2019 and currently stands at $1.8 trillion, although it was set to surpass $2 trillion in 2021. |
Let's take a look at Microsoft's stock performance over the past few years:
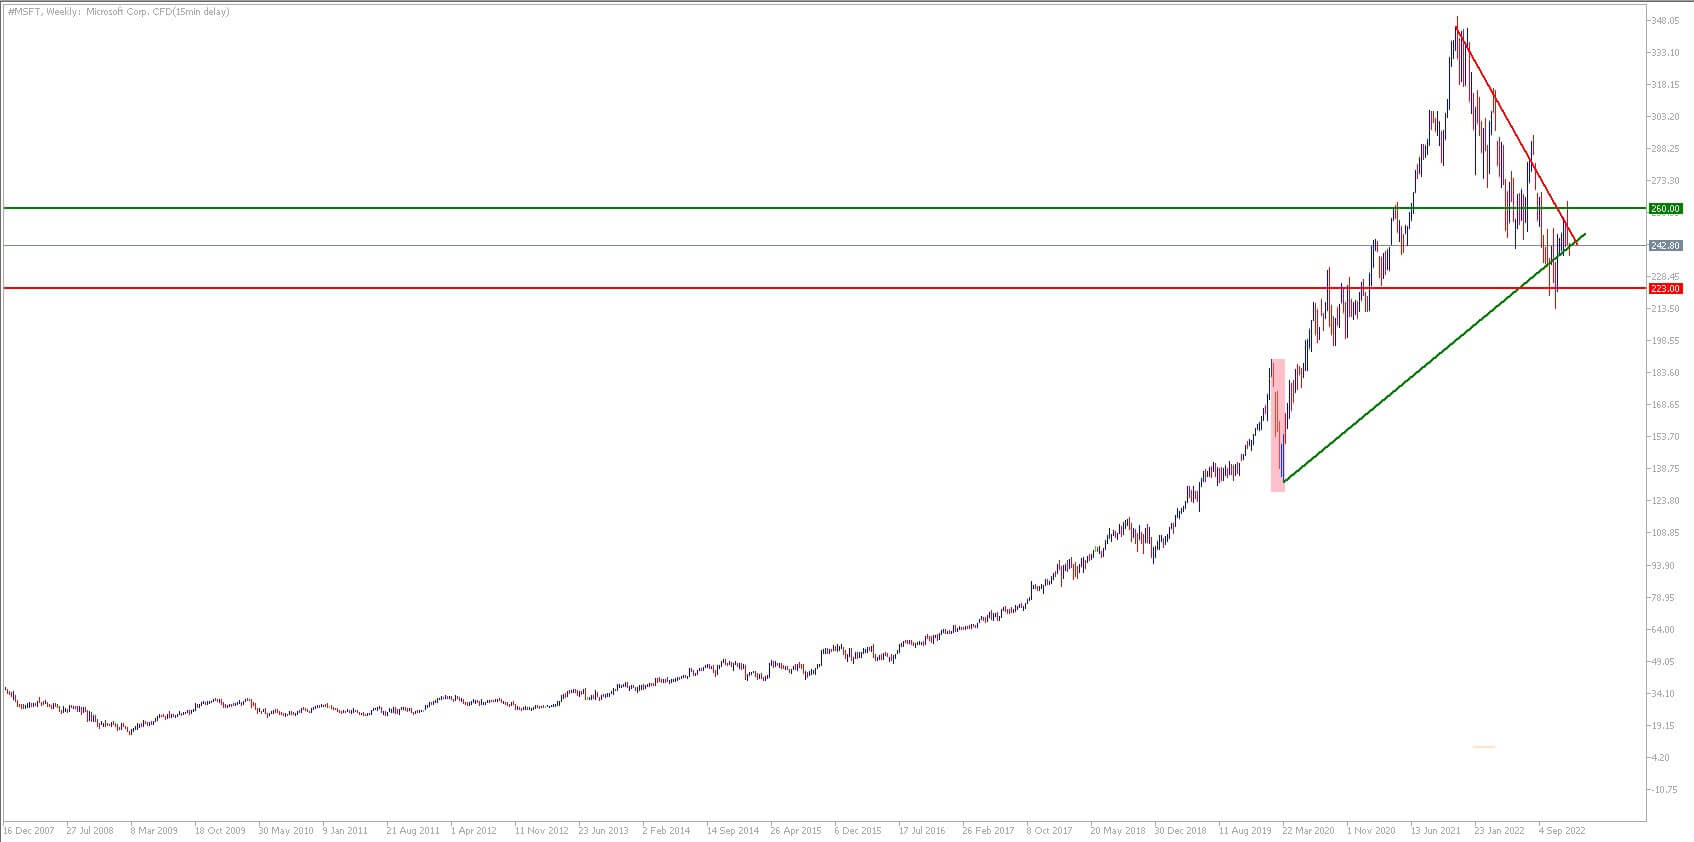
As the chart shows, Microsoft's stock performance has been very positive since 2014, with a more pronounced upward trend beginning in early 2019. It was undoubtedly a profitable trade for the long-term trader who invested in Microsoft in 2014.
The chart also shows how well Microsoft has weathered the coronavirus, as it joined the wave of declines in mid-March 2020, but quickly recovered and reached its all-time high of $345 in November 2021.
ARAMCO
The Saudi Monarchy owns Aramco, the world's largest oil company. This behemoth manages one out of every nine barrels of crude oil produced in the world and earns more than $300 billion in revenue.
Its history begins in the early twentieth century, in the 1930s, with the first exploration concessions granted on Saudi territory. In the 1940s, it was renamed Aramco and was owned by US corporations.
In the 1980s, the Saudi government purchased 25% of the oil company, gradually increasing this percentage over the years until it owned 100% of the company.
In 2016, the oil company announced plans to list 5% of its shares on the stock exchange the following year in order to raise approximately $100 billion. The IPO was postponed for several years. Aramco debuted on the Riyadh Stock Exchange in December 2019 at a price of 32 rials, or about $8 per share.
It increased by 10% to 35 rials on its first crossing. It rose to 38 rials in the following days, but the first impact of the coronavirus crisis, in early March 2020, triggered volatility in Aramco's share price, which was exacerbated by the collapse in the price of oil futures maturities. It hit a low of 27 rials on March 16. It has gradually recovered since then.
| The stock was trading at 31 rials on December 21, 2022. It has a market capitalisation of USD 1.8 trillion (SAR 6.82 trillion). |
The stock of Saudi Aramco is not yet available on Admirals because it is not yet listed on a western stock exchange.
ALPHABET (GOOGLE) (GOOG)
Since August 2015, Google, now known as Alphabet, has been one of Wall Street's biggest success stories. It began as a search engine and has grown into a global web empire as a result of significant business diversification.
The uptrend in Google's stock began in August 2012, with a break above the $650 resistance zone, and reached a high of around $1228 in February 2014, just days before Google decided to split its stock.
This did not affect Google's stock price, which is expected to surpass $3,000 in October 2021.
Let's look at the weekly chart to see how it's changing:
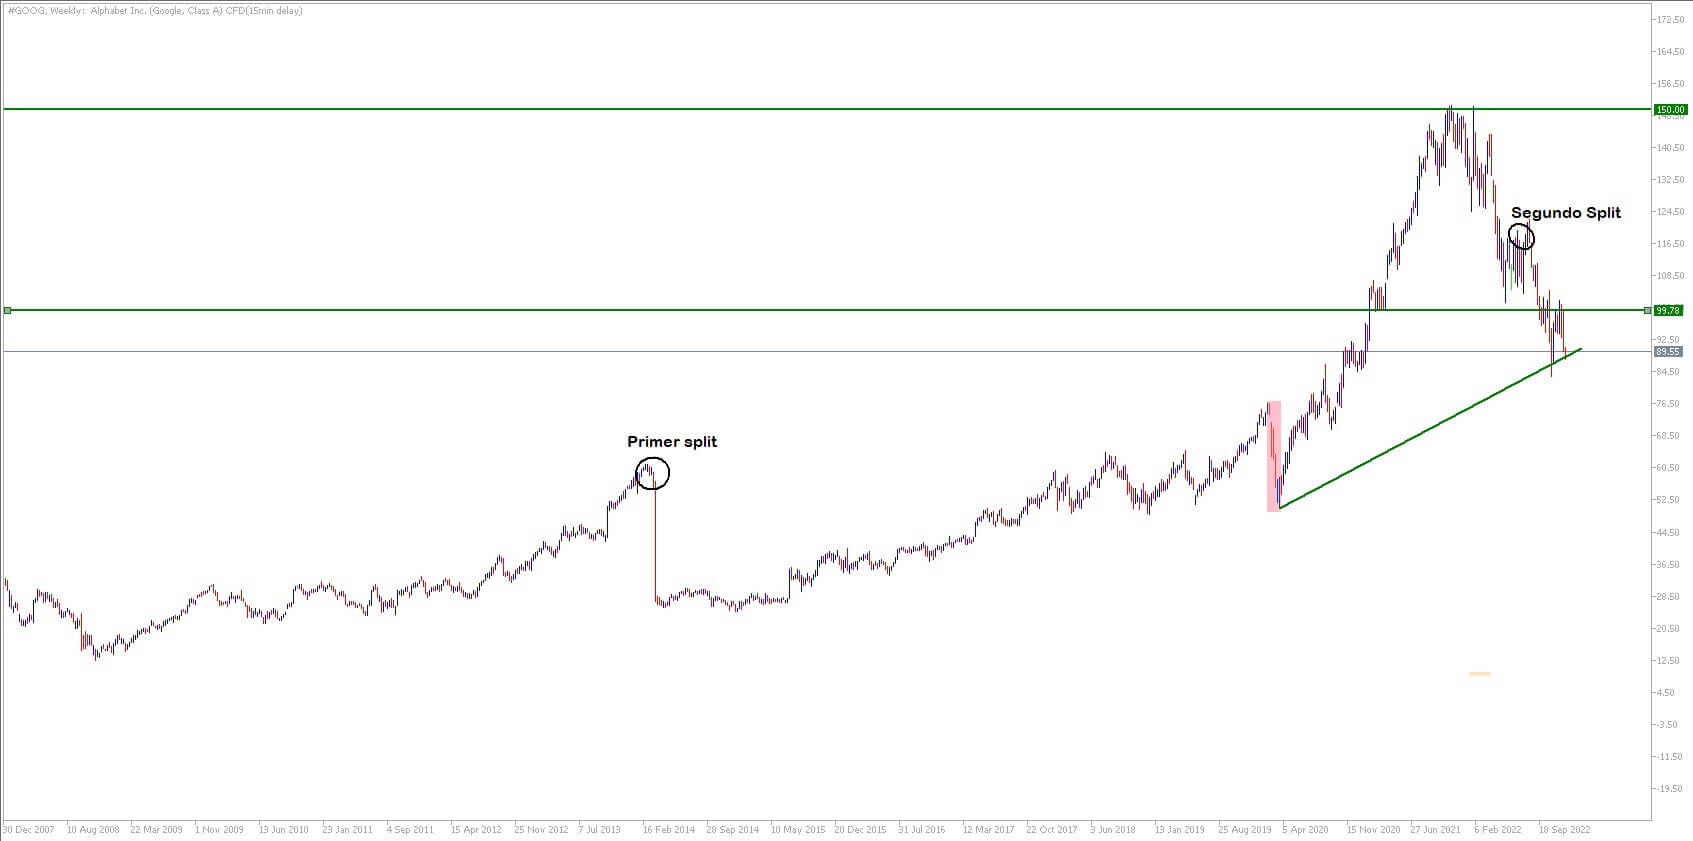
Google's uptrend started in July 2012 and lasted until February 2014, when it reached the USD 1223 level, shortly before it made its first stock split. After a price adjustment, it resumed the uptrend until a brief dip in March 2020 due to the Covid-19 pandemic (highlighted with a pink rectangle).
In October 2021 it touched the USD 3020 level, its all-time high so far, before falling back in the first months of 2022 to the support of 2260, the price at which it was trading shortly before a second 20x1 stock split.
Be that as it may, Google's overall situation is quite favourable, so it still has great potential in the stock market. However, as with Amazon, the monopoly situation worries the authorities and it could face not only stricter regulation in the future but also new taxes.
AMAZON (AMZN)
Despite appearances, Amazon's history dates back to 1994, when Jeff Bezos founded the company with the goal of becoming the world's largest retailer. In terms of online commerce, this is a nearly completed goal.
Furthermore, Jeff Bezos' company has followed in the footsteps of technology behemoths like Apple and Microsoft by diversifying its business with its own brands like Amazon Music, Amazon Web Services, e-books (Kindle), smart speakers (Echo), and so on. With Amazon Prime, it has recently joined the wave of streaming platforms.
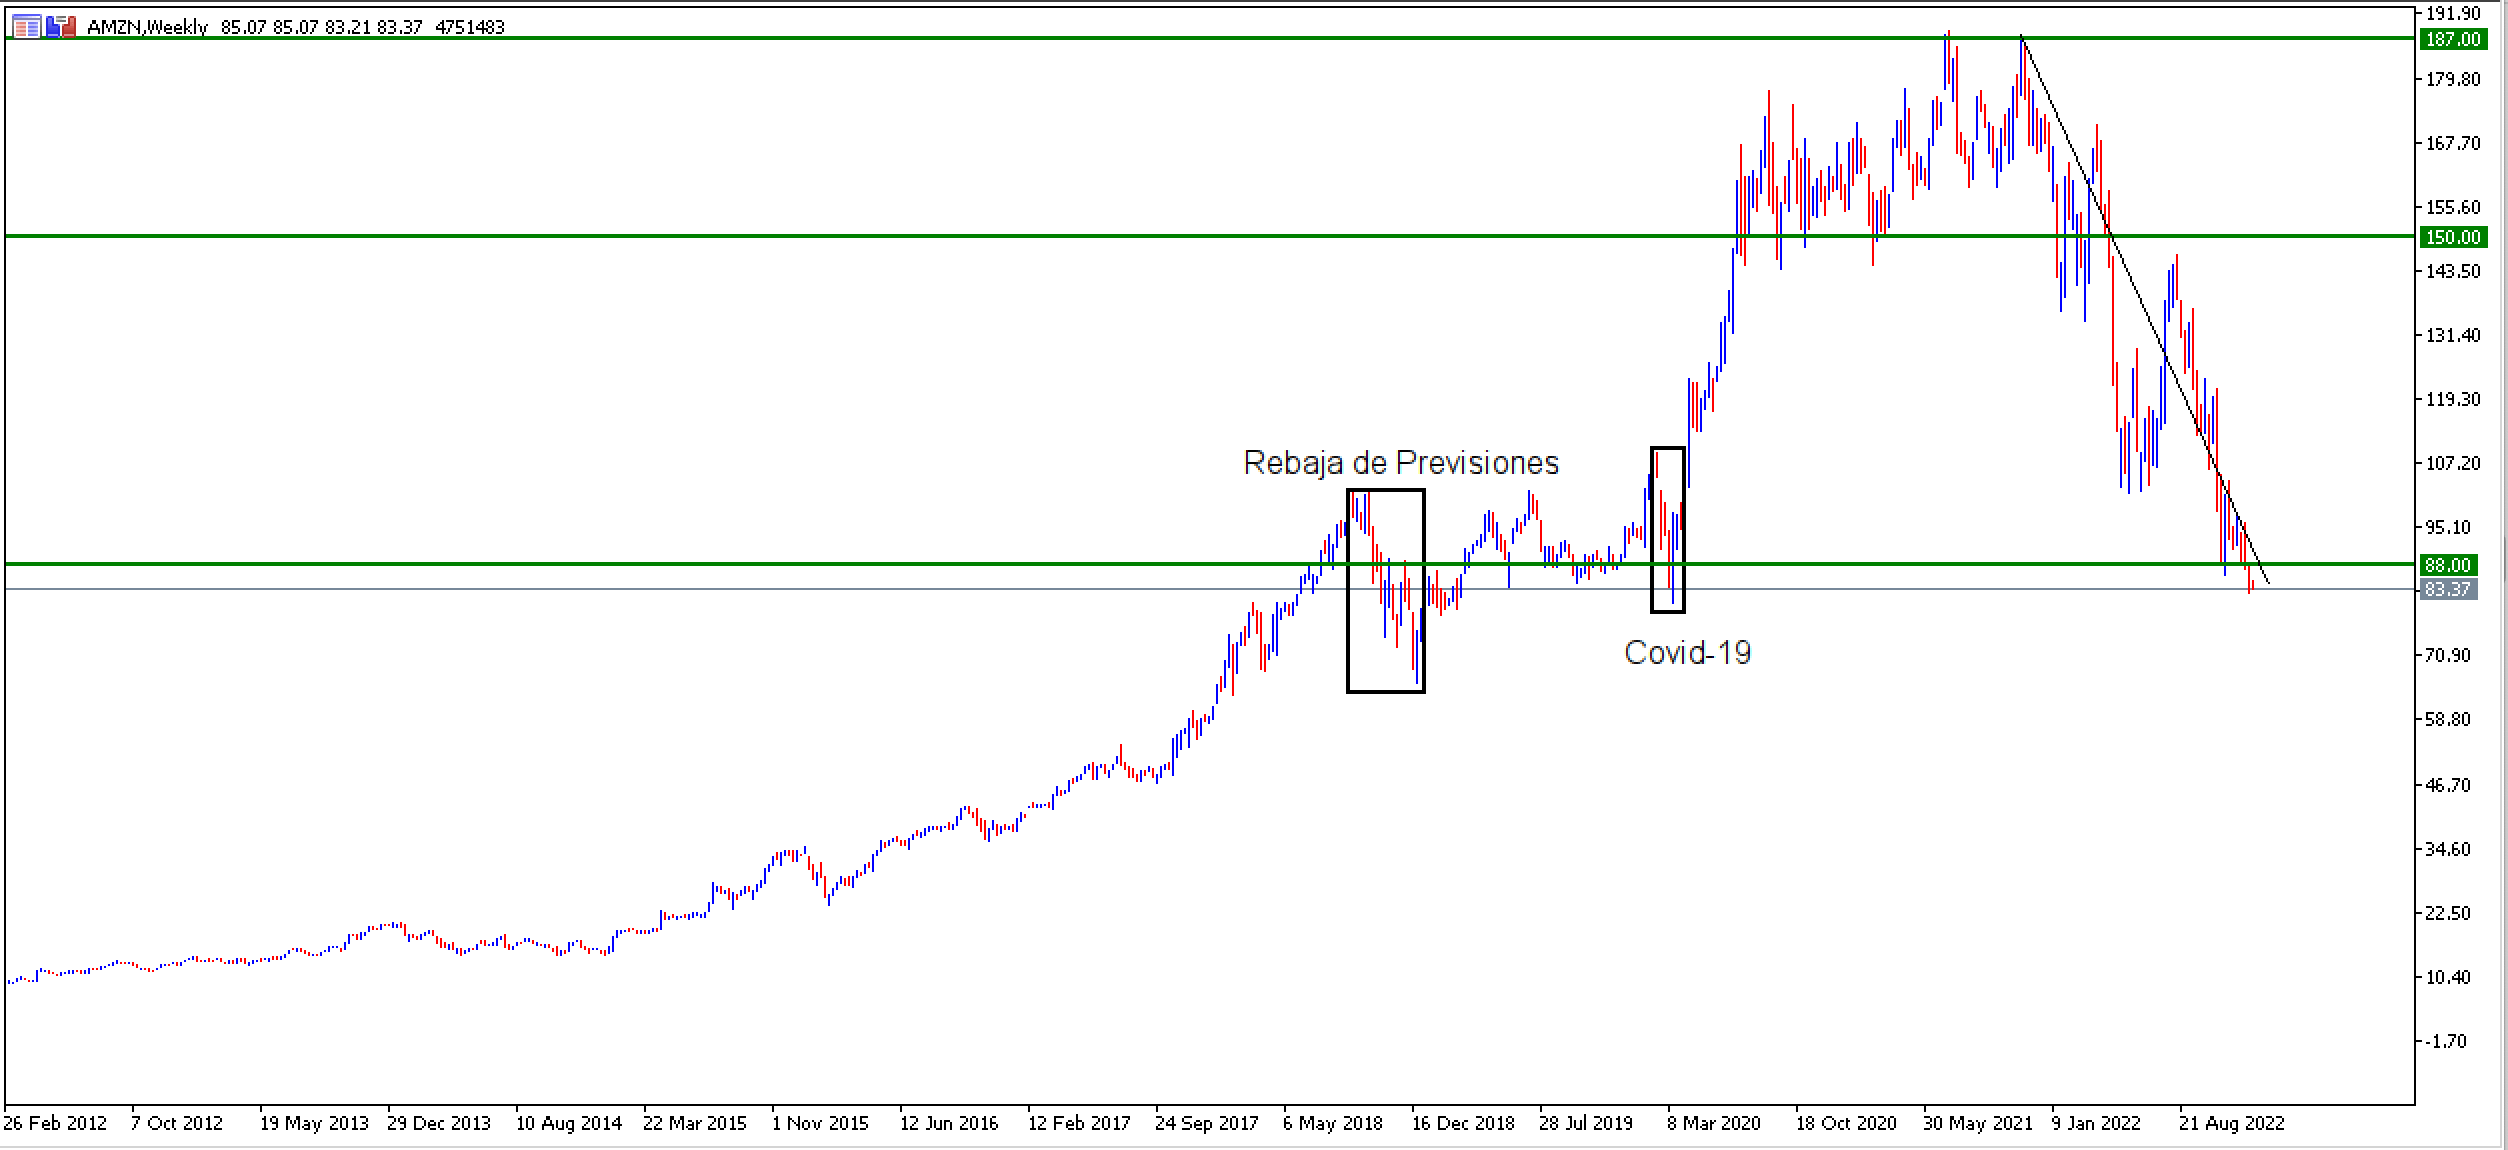
Amazon's chart also shows a long-term upward trend dating back to 2015. There is a significant setback in 2018 due to lower-than-expected sales. However, it quickly returns to an upward trend until the Covid-19 pandemic causes a generalized fall in March 2020.
The correction is brief, and the price quickly returns to, if not exceeds, pre-pandemic levels. From July 2020 to April 2022, the price fluctuated between USD 3760, its previous all-time high, and USD 3013.
Because of the high price, Amazon conducted a 20-for-1 stock split in June 2022.
This reduced the stock's price by a factor of 20 and made it more affordable. It is currently trading at around USD 88 as of December 28, 2022, following a sustained decline since November 20, 2021.
If you want to practice some strategies with the stocks we've seen so far, you can do so in a virtual environment that is both safe and capitalised, using a demo account. Admirals allows you to open a free demo account and trade stocks directly or through contracts for difference (CFDs) on stocks. To register, click the button below:

BERKSHIRE HATHAWAY (BRKB)
Berkshire Hathaway, owned by the famous investor Warren Buffett, is the world's sixth most valuable company today, specializing in equity investments. It owns stakes in many of the world's most powerful corporations, including Apple, Bank of America, Coca-Cola, Wells Fargo, and American Express.
The 'Oracle of Omaha,' as he is known, has been at the helm of this company for more than five decades, with great success given that it is one of the most valuable companies in the world.
Let's look at the long-term graph:
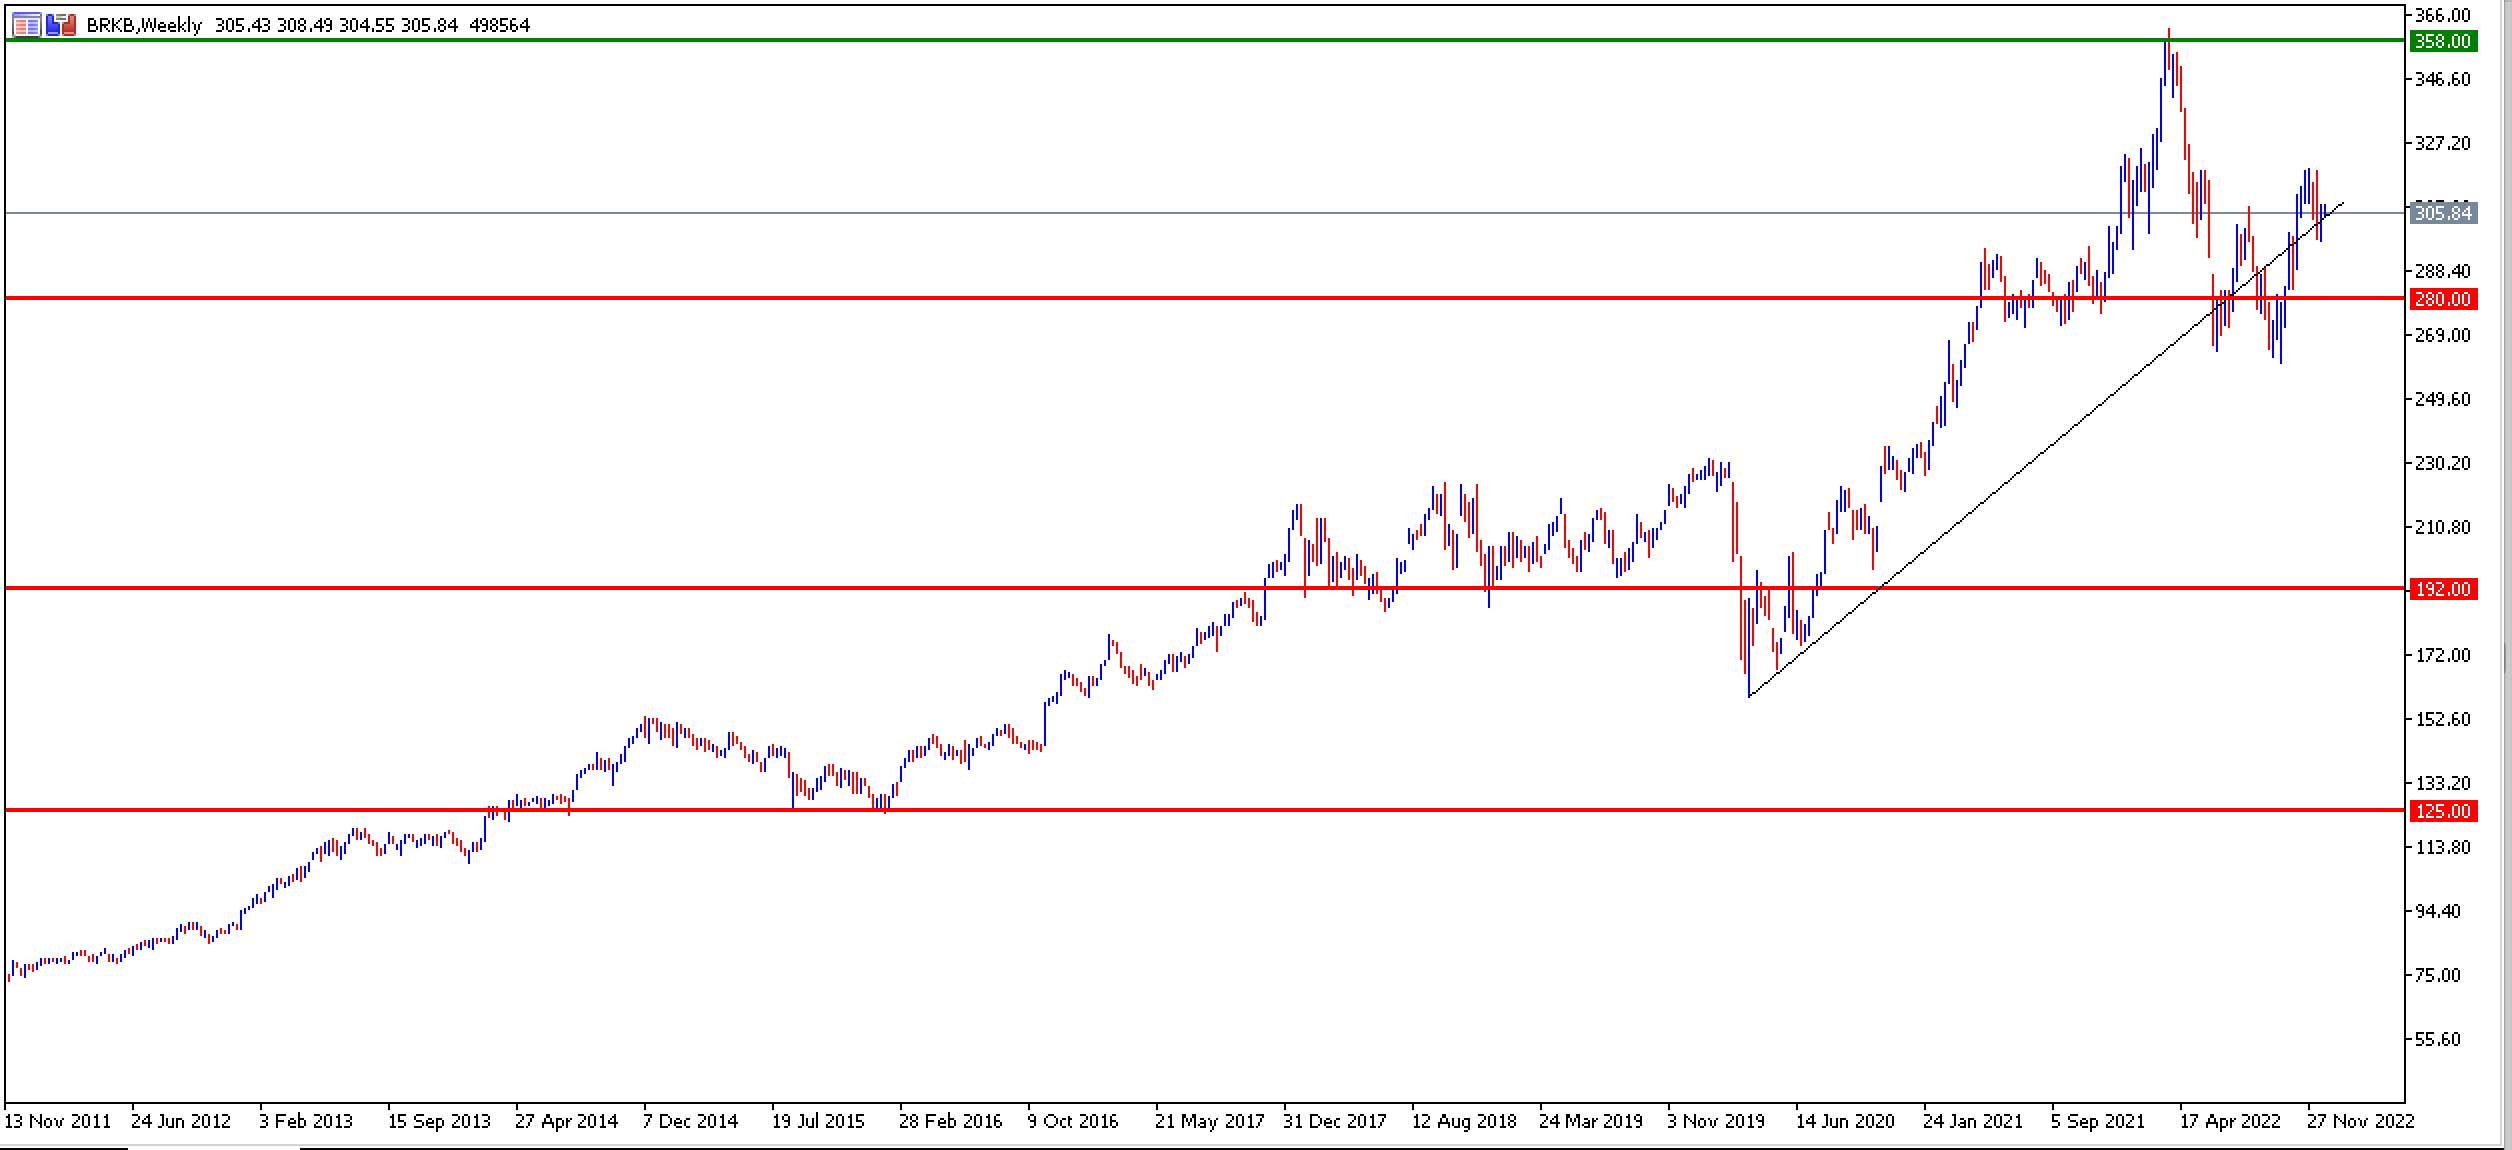
The chart shows how Berkshire Hathaway has been in an uptrend for more than a decade. In March 2020 it falls back when the markets collapse due to the Covid-19 pandemic, but soon rebounds more strongly.
From then, at the end of March 2020, until the last week of March 2022, the price of Berkshire Hathaway accumulated a 93% appreciation, from the level of USD 160 to USD 358, the highest level ever.
From March 2022 to 28 December 2022, the share price fell back to around USD 305.
Looking for more assets? Click on the following to discover what else is offered at Admirals:

UNITEDHEALTH (UNH)
UnitedHealth Group is the world's second largest healthcare company in terms of revenue, so it's no surprise that it's one of the top ten most valuable companies.
In times of high market volatility, such as 2022, healthcare is considered a defensive sector because demand remains constant regardless of the economic situation.
The stock price chart of UnitedHealth Group demonstrates the sector's strength:
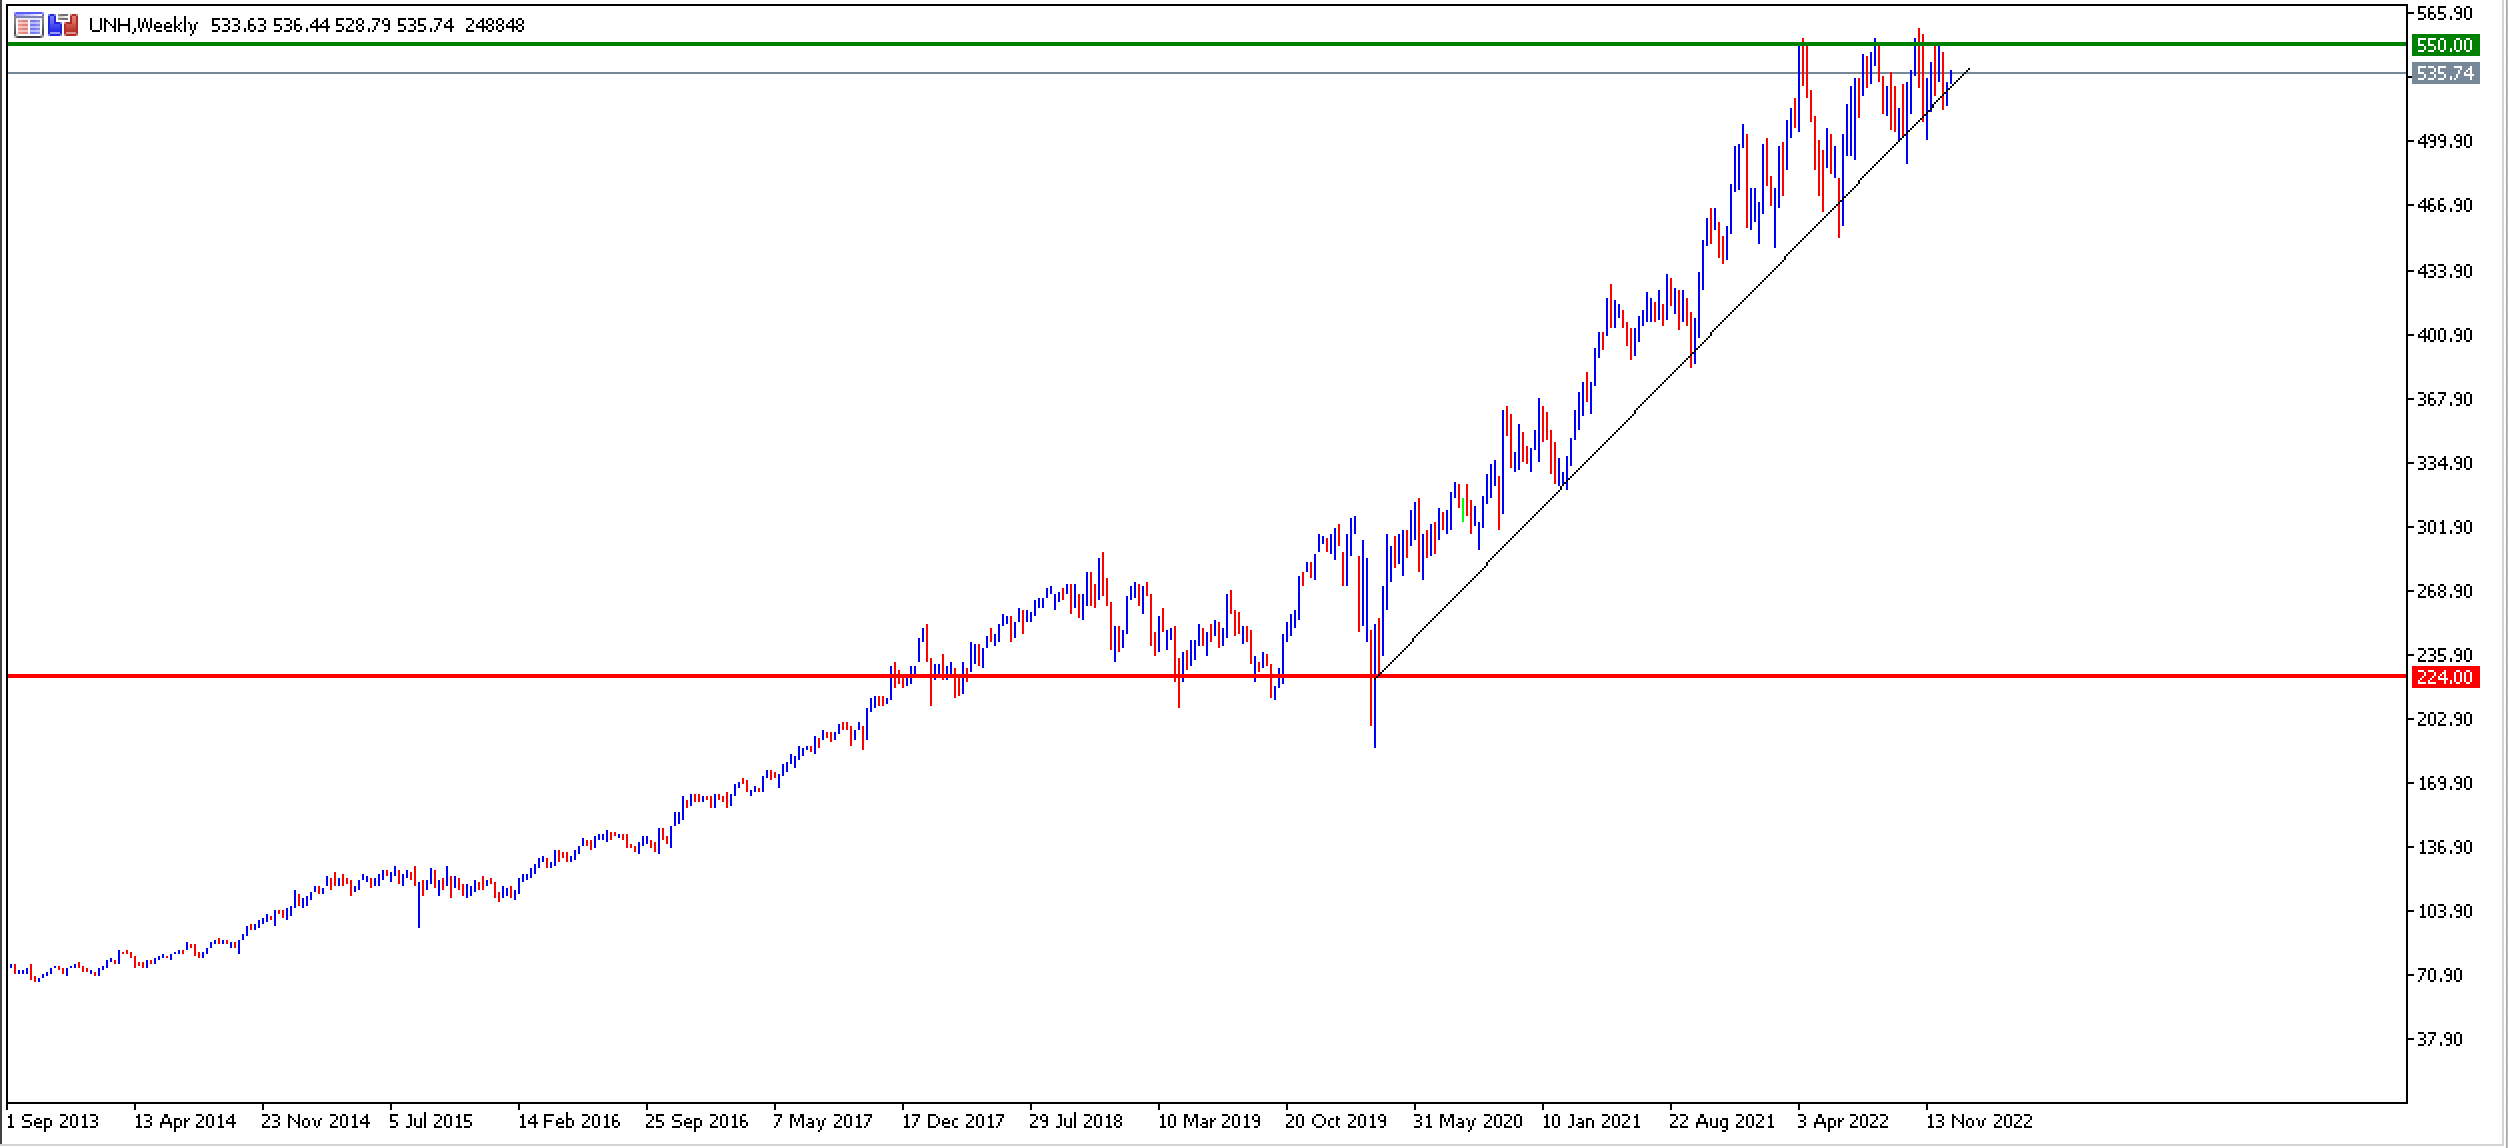
The chart above clearly shows UnitedHealth's share price rising since the start of the Covid-19 pandemic in March 2020. The price has risen from USD 224 to USD 550 since then.
JOHNSON & JOHNSON (JNJ)
Johnson & Johnson is one of the top ten most valuable companies. This is another defensive company that can withstand crises because its (health) products will continue to be consumed regardless of what happens.
It was founded in 1886, and its debt is rated AAA by rating agencies, indicating an extremely low risk of default.
Let's see how Johnson & Johnson has performed in the stock market:

The chart of Johnson&Johnson clearly shows the stock's sustained uptrend from USD 62 to USD 178 on multiple occasions in 2022. The price will remain between USD 160 and 178 between December 2020 and December 2022.
TESLA (TSLA)
Tesla was founded in 2003, but its popularity skyrocketed after Elon Musk became CEO in 2008. He had become a shareholder four years before. The electric vehicle manufacturer went public in 2010 at a price of USD 17 per share.
A decade later, the price had risen to USD 2,300. As a result, the company decided to conduct a stock split in August 2020, dividing each share into five parts. As a result, each share began trading at USD 440.
In August 2022, Tesla again split its shares, this time in a 3:1 ratio.
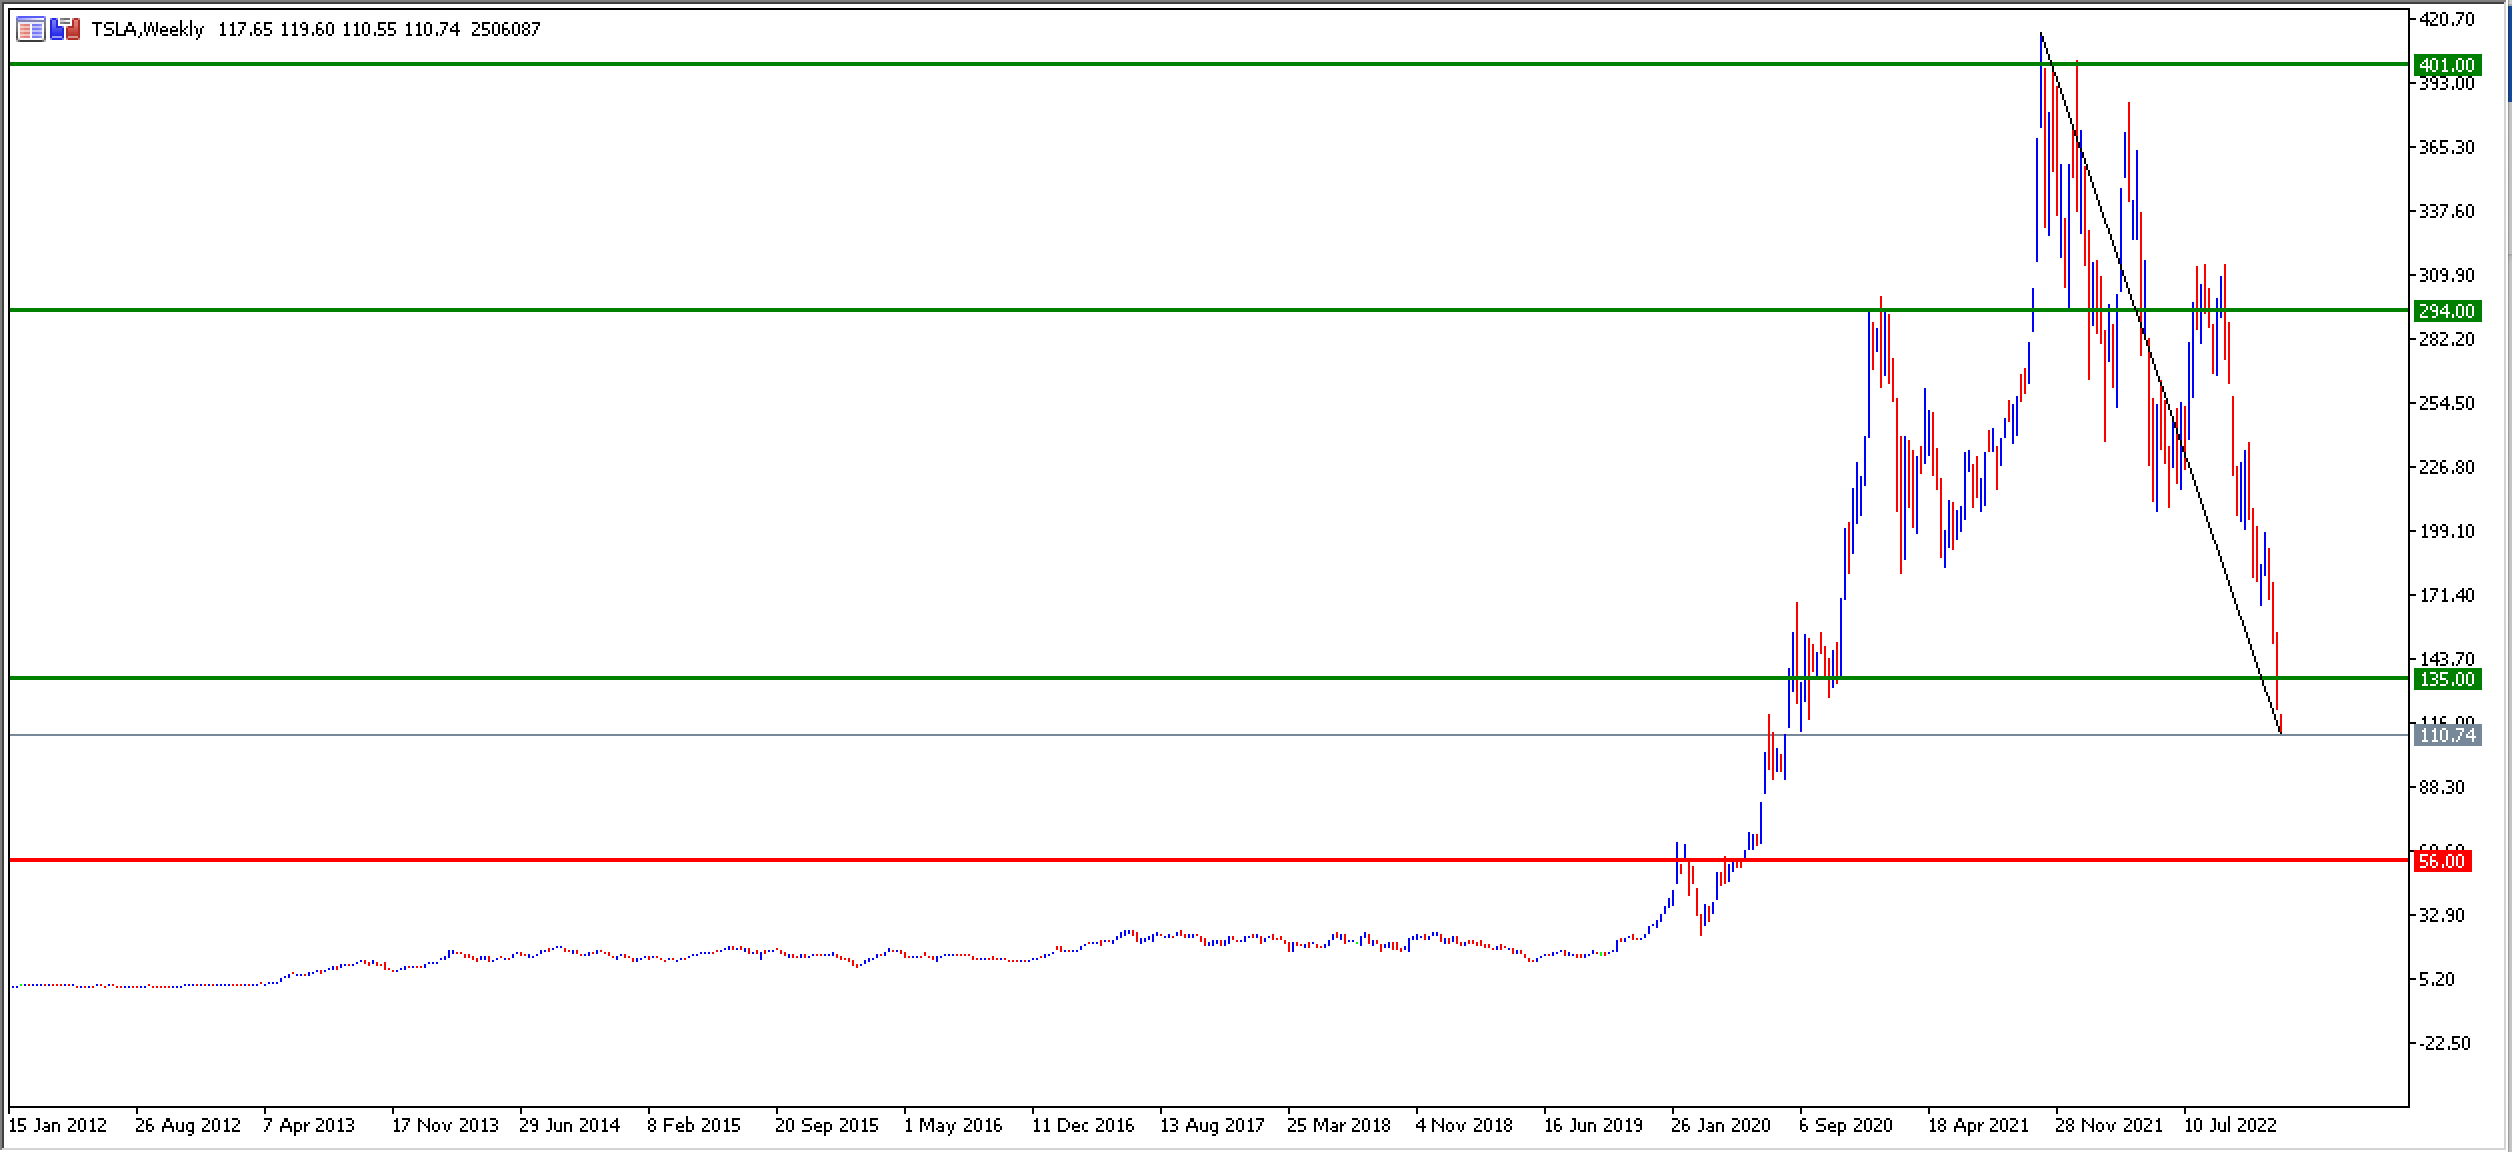
The graph shows how Tesla shares were trading at 55 dollars just before the Covid-19 pandemic. After falling to 23 dollars in March 2020, it began an upward trend that would take it above 400 dollars in October 2021. Since then, the price has steadily declined to $110, where it will trade on December 28, 2022.
However, the company was ranked seventh with a value of nearly $1 trillion just seven months ago.
VISA (V)
When Bank of America introduced the BankAmericard credit card in 1958, Visa was born. The 1980s and 1990s were critical years in the international expansion of the Visa brand, which benefited from the installation of ATMs in the busiest areas of the United States.
Visa was listed on the New York Stock Exchange in March 2008 at a price of USD 43.5 per share.
Let's take a look at how the company has performed on the stock market:
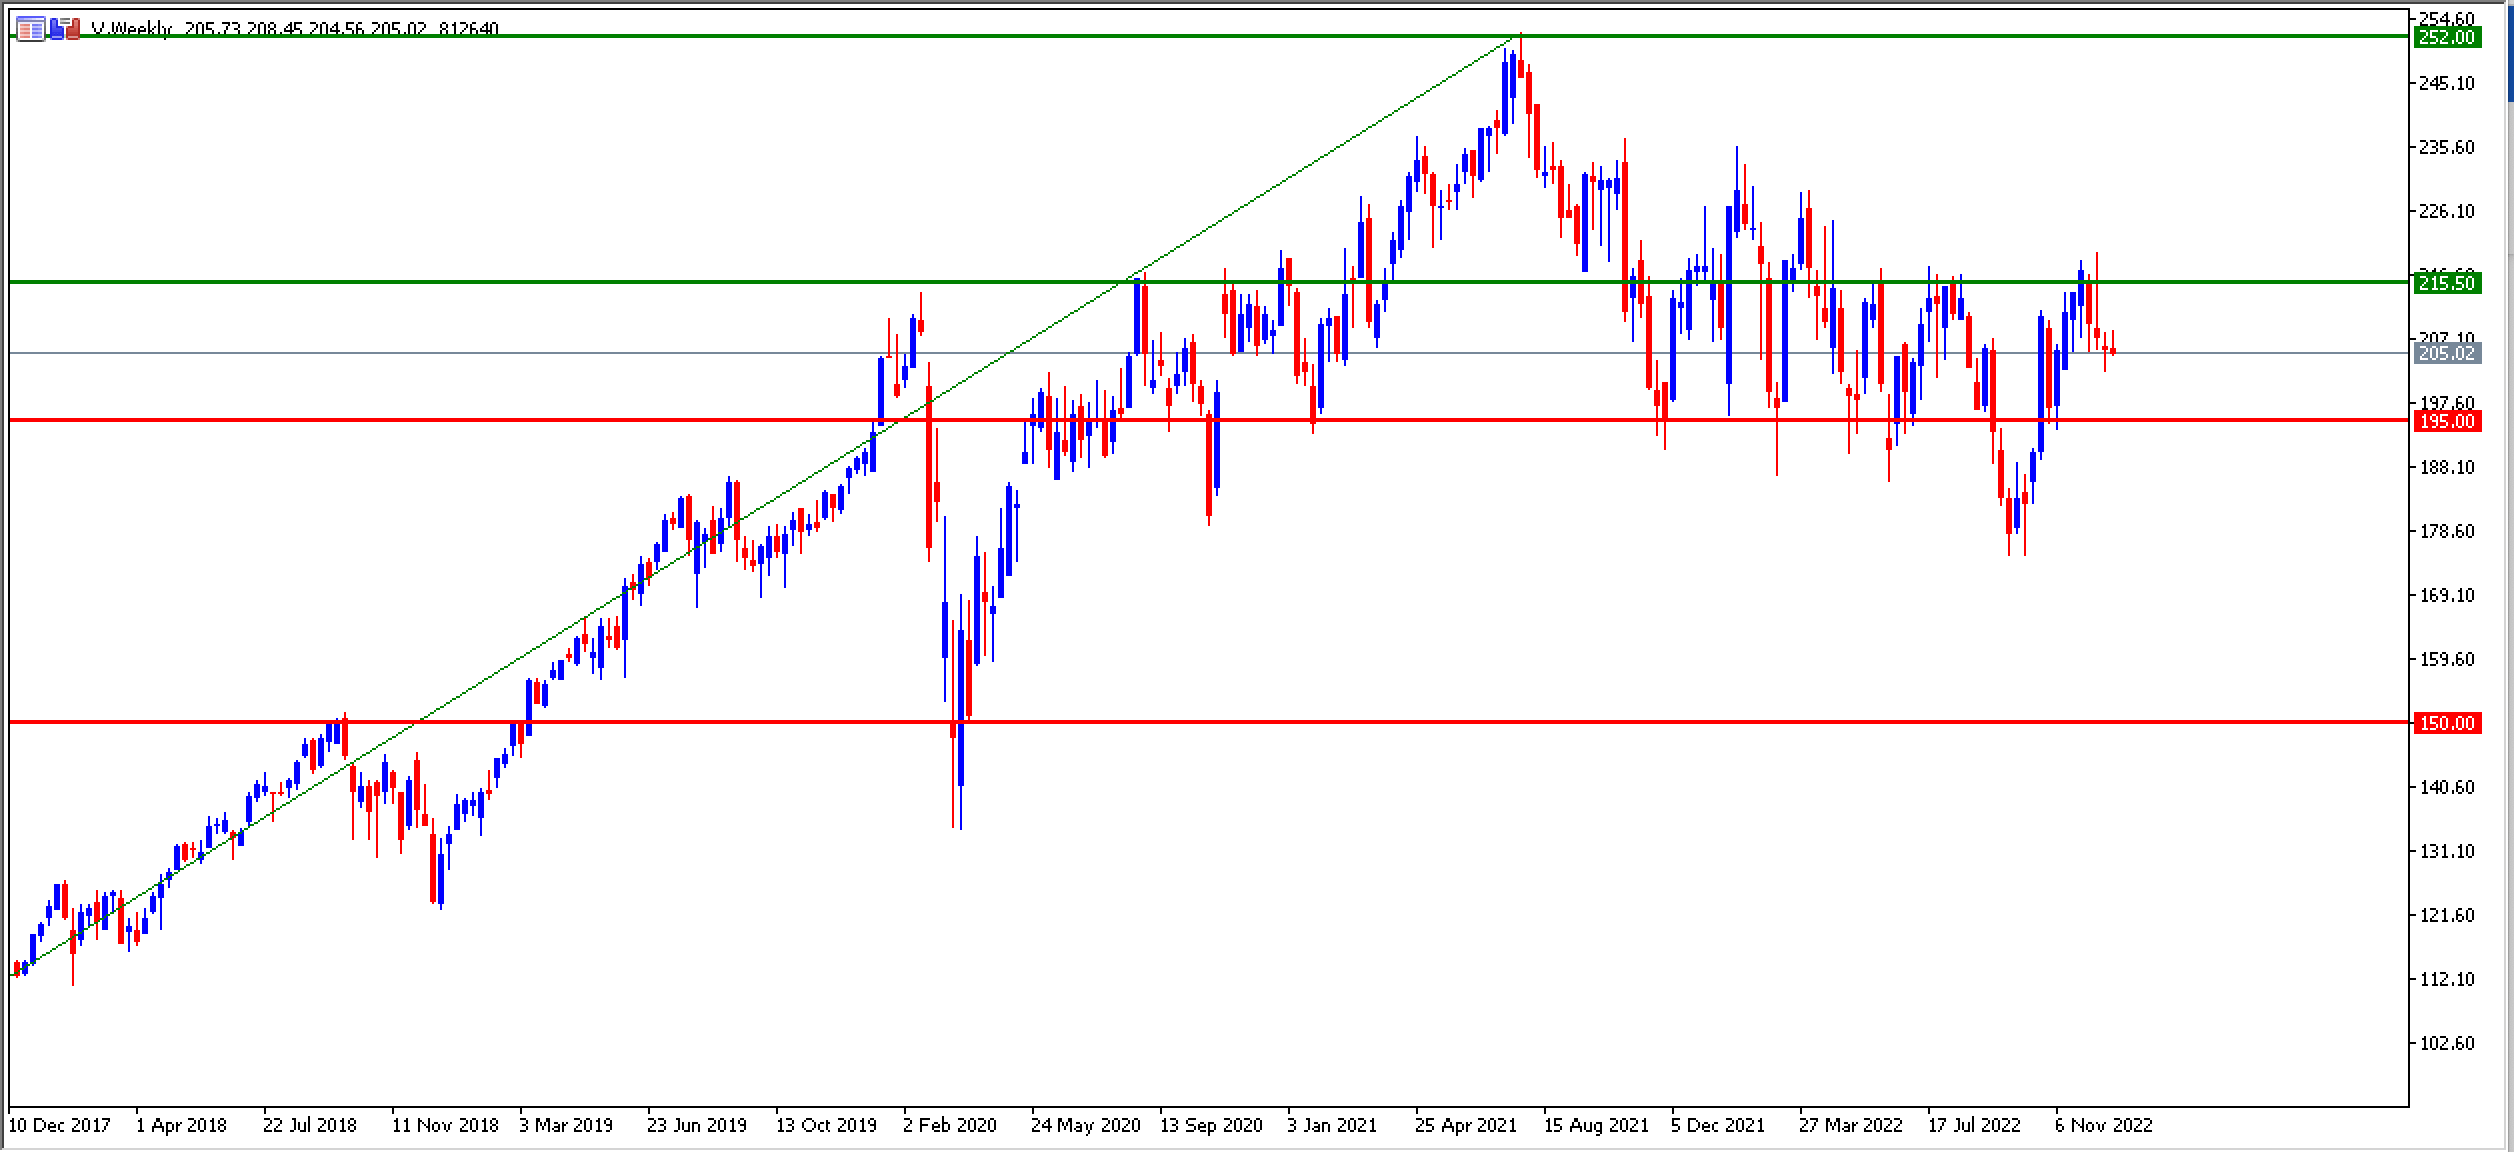
VISA's price chart shows a consistent upward trend until July 2021, when it reaches USD 252. The price has since retreated and entered a sideways channel between USD 195 and USD 215.50.
Most Valuable Companies: How to Start Investing
In bearish scenarios, there is the option of investing in shares via CFDs or Contracts For Difference, which allow for short trading and leverage, i.e. the position does not have to be deposited in full but can be opened with a small margin.
This tool can multiply profits but also losses, so it should be used with caution and risk management.
Admirals provides direct access to thousands of shares and ETFs listed on 15 of the world's leading stock exchanges via the Invest.MT5 account.
CFDs can also be traded. If you do not feel ready to begin trading and require additional training, you can sign up for our free webinars and live trading sessions on YouTube Admirals.
Simply register by clicking on the banner below:

Other articles that may also be of interest to you:
- What is Leverage in Forex?
- What is a VPS in trading and how can I take advantage of it?
- Top Financial Markets To Trade In 2023
INFORMATION ABOUT ANALYTICAL MATERIALS:
The given data provides additional information regarding all analysis, estimates, prognosis, forecasts, market reviews, weekly outlooks or other similar assessments or information (hereinafter “Analysis”) published on the websites of Admiral Markets investment firms operating under the Admiral Markets and Admirals trademarks (hereinafter “Admirals”). Before making any investment decisions please pay close attention to the following:
1. This is a marketing communication. The content is published for informative purposes only and is in no way to be construed as investment advice or recommendation. It has not been prepared in accordance with legal requirements designed to promote the independence of investment research, and that it is not subject to any prohibition on dealing ahead of the dissemination of investment research.
2. Any investment decision is made by each client alone whereas Admirals shall not be responsible for any loss or damage arising from any such decision, whether or not based on the content.
3. With view to protecting the interests of our clients and the objectivity of the Analysis, Admirals has established relevant internal procedures for prevention and management of conflicts of interest.
4. The Analysis is prepared by an independent analyst (hereinafter “Author”) based on the NAME +(Position) personal estimations.
5. Whilst every reasonable effort is taken to ensure that all sources of the content are reliable and that all information is presented, as much as possible, in an understandable, timely, precise and complete manner, Admirals does not guarantee the accuracy or completeness of any information contained within the Analysis.
6. Any kind of past or modeled performance of financial instruments indicated within the content should not be construed as an express or implied promise, guarantee or implication by Admirals for any future performance. The value of the financial instrument may both increase and decrease and the preservation of the asset value is not guaranteed.
7. Leveraged products (including contracts for difference) are speculative in nature and may result in losses or profit. Before you start trading, please ensure that you fully understand the risks involved.