Momentum Trading Strategy: How to Use It, Indicators & Setups
Having the right trading strategy is essential in navigating the fast-paced nature of financial markets. While there are a variety of different approaches available, momentum trading strategies are often used by traders who aim to identify and potentially benefit from sustained price movements in a particular direction.
In this guide, we will explore what is momentum trading, along with a clear momentum trading strategy explanation covering how it tends to work in practice. We will also look at commonly used momentum trading indicators and momentum trading strategies. Each section covers how traders typically apply these approaches, what to watch for, and where the risks tend to lie.
The information in this article is provided for educational purposes only and does not constitute financial advice. Consult a financial advisor before making investment decisions.
Table of Contents
- What is Momentum Trading Strategy?
- 4 Essential Momentum Trading Indicators for Trend Analysis
- Momentum Trading Strategies for Different Trading Styles
- Momentum Trading vs Other Trading Strategies
- Markets Where Momentum Trading Is Commonly Applied
- How to Momentum Trade More Thoughtfully
- Why Start Momentum Trading with Admirals?
- Frequently Asked Questions on Momentum Trading Strategy
What is Momentum Trading Strategy?
A momentum trading strategy focuses on identifying assets that are already moving strongly in one direction. Instead of trying to predict the very beginning of a trend, momentum traders usually look for signs that an existing move has enough strength to continue.
For example, a trader may look at rising prices, higher trading volume, or momentum indicators to assess whether buyers or sellers remain in control. However, momentum can weaken quickly, so traders also need to watch for signs of exhaustion or reversal.
How Does a Momentum Trading Strategy Work?
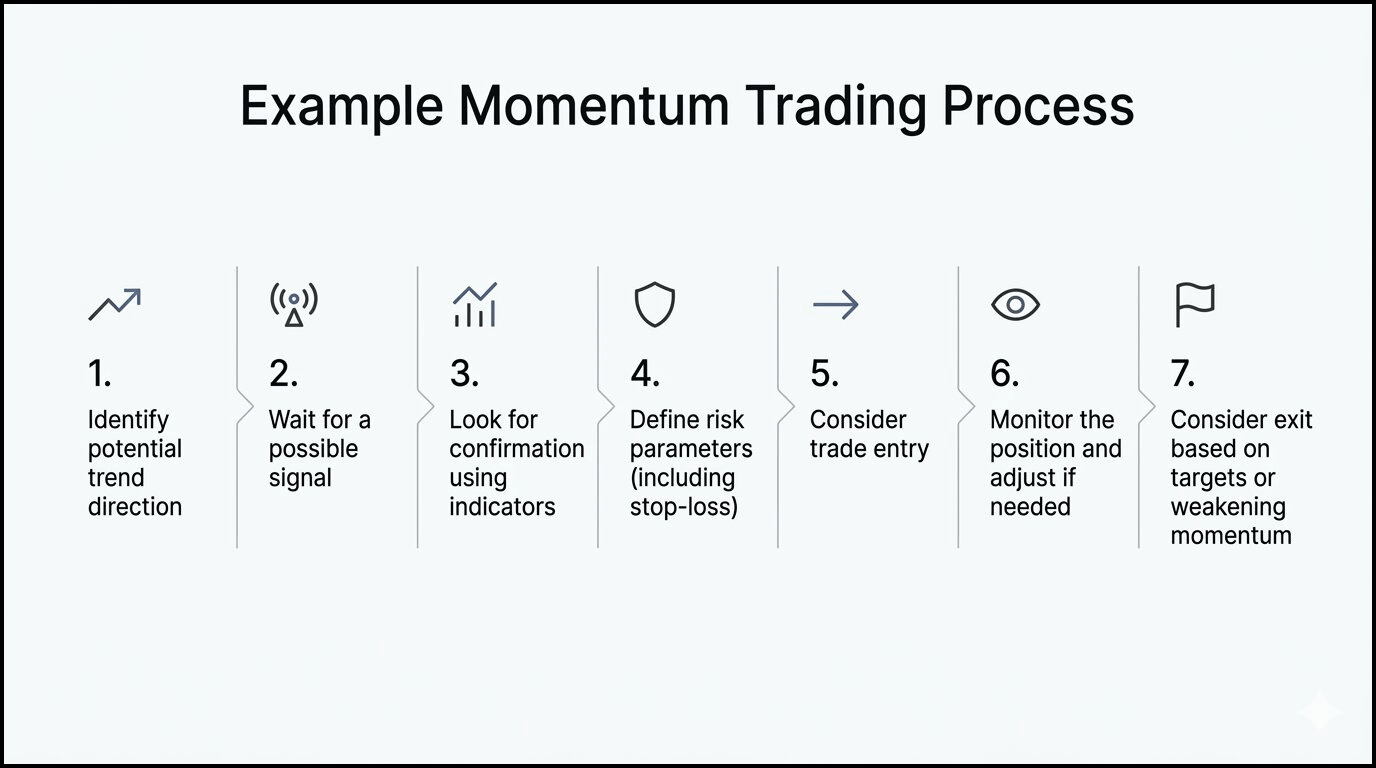
A momentum-based trading strategy generally follows a sequence like the one below.
Momentum trading works by focusing on three key elements:
- Velocity: how fast price is moving
- Magnitude: how strong the move is
- Sustainability: whether momentum is increasing or fading
Traders combine these to:
- Identify strong trends
- Avoid weak or choppy conditions
- Filter false breakouts
How to Use a Momentum Trading Strategy (Step-by-Step):
- Identify a strong trend using price action or moving averages
- Confirm momentum using indicators like RSI, MACD, or ADX
- Wait for a pullback or breakout setup
- Enter the trade when momentum aligns with trend direction
- Place a stop-loss below/above recent structure
- Manage the trade based on momentum continuation or weakening signals
4 Essential Momentum Trading Indicators for Trend Analysis
Momentum traders often use a small group of indicators to evaluate trend direction and strength. Here are four commonly used indicators in momentum trading.
1. Moving Average: An Indicator for Momentum Direction
Moving averages smooth price data to highlight trend direction and filter out short-term noise. Traders often watch whether price is above or below a rising or falling average to assess directional bias, and may use pullbacks to the 20 or 50 EMA as potential entry areas.
Since moving averages are based on past prices, they can lag and may give false momentum trading signals in choppy markets.
.png)
2. MACD: An Indicator for Momentum Direction and Strength
Moving Average Convergence Divergence (MACD) measures the relationship between two moving averages, typically the 12 and 26-period EMAs, and plots the difference as a signal line and histogram.
In a MACD momentum strategy, traders often watch for MACD line crossovers and then use the histogram to judge whether momentum may be building or fading. Divergence between MACD and price may also indicate weakening momentum. As a lagging indicator, MACD can produce frequent signals in sideways markets.
| Histogram Behaviour | What It May Indicate |
| Growing after crossover | Momentum potentially building |
| Flat after crossover | Weak conviction (worth monitoring) |
| Shrinking after crossover | Possible fade (may warrant caution) |
| Diverging from price | Momentum may be weakening |
.png)
3. RSI: An Indicator for Momentum Strength
Momentum trading with RSI, or the Relative Strength Index, is a common approach. RSI measures the strength of recent price action on a 0-100 scale and may hint at direction. It is commonly used to assess whether momentum is strengthening or weakening.
Many traders focus on whether RSI is holding above or below 50 rather than relying only on overbought or oversold readings. Divergence between RSI and price is also often watched as a possible sign of slowing momentum.
In an RSI momentum strategy, traders should remember that RSI can remain elevated or depressed for long periods in strong trends, so it is usually interpreted alongside price action rather than on its own.
4. ADX: An Indicator for Trend Strength
Average Directional Index (ADX indicator) measures trend strength without indicating direction. This distinction matters because ADX does not tell traders whether price is rising or falling. It only indicates whether a trend of either kind has strength behind it.
Readings above 25 are sometimes associated with a trending environment, while readings below 20 may suggest a more range-bound market where momentum signals are less reliable. Because ADX often rises after a trend is already underway, it is typically used alongside a directional indicator rather than on its own.
| ADX Reading | Common Interpretation |
| Below 20 | Ranging (momentum signals may be less reliable) |
| 20-25 | Trend developing (worth monitoring) |
| Above 25 | Trending environment (may support momentum entries) |
| Above 40 | Strong trend (though reversal risk can also increase) |
.png)
Momentum Trading Strategies for Different Trading Styles
Understanding the indicators is only part of the picture. How those tools are actually applied depends on the type of momentum strategy being used. Below are the main approaches, along with how each indicator tends to play a role in each setup.
1. Momentum Breakout Trading Strategy
A momentum breakout trading strategy involves entering a trade when price moves beyond a clearly defined level, such as a consolidation zone or a previous high, low, or price swing, or a chart pattern boundary, with momentum appearing to support that move.
The logic is that once price clears a significant level with force, other participants may respond and push it further in the same direction.
In practice, traders often look for a few things to align:
- A well-defined level
- Signs of expanding momentum at the point of break, visible in the MACD histogram or a rising ADX
- A candle close beyond the level rather than just a brief wick through it
.png)
False breakouts are a known risk. Price can push through a level and quickly reverse, particularly when follow-through is limited. Some traders attempt to manage this by waiting for a retest of the broken level before entering.
2. Momentum Reversal Trading Strategy
A momentum reversal trading strategy takes a different approach. Rather than following a trend, traders look for signs that momentum may be fading and position themselves for a potential change in direction.
This is worth approaching carefully, as trading against an established trend carries additional risk and this type of setup tends to be used selectively.
Common signals to watch for include:
- Divergence between price and RSI or MACD, where price makes a new high or low but the indicator does not
- An ADX reading that has remained elevated for a sustained period and begins to decline
- A visible slowdown in the MACD histogram following a prolonged move
_(1).png)
None of these signals confirm a reversal on their own, but together they may suggest momentum is weakening. Most traders look for price confirmation, such as a break of a short-term structure level, before acting rather than attempting to pick a top or bottom outright.
3. Momentum Day Trading Strategies
Momentum day trading refers to intraday approaches where traders aim to capture short, directional moves within a single session. This is why this approach is often considered a short-term momentum trading strategy.
A day trading momentum strategy usually combines higher-timeframe context with lower-timeframe execution.
One commonly used intraday momentum trading strategy involves identifying the broader session bias on a higher timeframe, such as the 1-hour chart, then looking for entries on a lower timeframe, like the 5-minute or 15-minute chart, when shorter-term momentum begins to align with that bias.
For example, if the 1-hour chart shows price above a rising 20 EMA with RSI holding above 50, a trader might look for a pullback entry on the 15-minute chart rather than entering an already extended move. This does not guarantee the move will continue, but it may help avoid chasing price at a poor level.
.jpg)
Stop losses are typically placed just below the most recent swing low or above the swing high, and traders tend to be mindful of session-specific liquidity windows, as market behaviour can vary considerably between active and quieter periods.
4. Scalping Momentum Trading Strategy
A scalping momentum trading strategy operates on the shortest timeframes, typically the 1-minute to 5-minute chart, and aims to capture small, quick moves as momentum briefly surges in one direction.
It is generally considered one of the more demanding approaches, given the pace of execution required and the need for timely decision-making.
Scalpers using momentum signals tend to watch for:
- Fast-moving averages such as the 9 or 20 EMA
- MACD crossovers on low timeframes
- Tight consolidations that resolve with conviction
Some traders approach this more systematically by coding rule-based criteria into an algorithm that scans and executes across multiple instruments. This is where an algorithmic trading momentum strategy can become relevant. Systematic execution can help reduce emotional bias, although an algorithm is only as sound as the rules it is built on.
5. Momentum Swing Trading
Momentum swing trading takes a broader view, with trades typically held over several days to a few weeks. Rather than targeting a quick intraday move, the aim is to participate in a meaningful trend while momentum remains supportive. Swing traders often focus on the daily or 4-hour chart to identify assets showing sustained directional strength.
Entries may come either from a pullback to a key moving average, such as the 20 or 50 EMA, or from a breakout above a well-defined level when momentum appears to be expanding.
- In pullback setups, traders may watch for RSI to ease back toward 50 before looking for signs of trend resumption.
- In breakout setups, they may look for strong price closes, increasing participation, or confirmation from indicators such as MACD or ADX.
Momentum Trading vs Other Trading Strategies
- Momentum trading: focuses on strong, ongoing price moves
- Trend trading: focuses on longer-term directional bias
- Scalping: targets very short-term price fluctuations
- Reversal trading: attempts to catch turning points
Momentum trading is typically based on existing price strength, with traders looking for signs that the current move may continue.
Markets Where Momentum Trading Is Commonly Applied
Momentum trading can be used across liquid markets where price movements and trading volume are strong, such as:
- Forex markets during strong directional moves
- Stocks with high volume or news catalysts
- Indices during trending market sessions
- Commodities with clear directional movement
However, liquidity alone does not guarantee clearer momentum signals. Traders should also consider volatility, spreads, news events, and the risk of false breakouts or reversals.
How to Momentum Trade More Thoughtfully
If you want to know how to momentum trade in a more disciplined way, a few practical habits can help:
- Focus on liquid markets where price movement is clearer and trends are easier to interpret.
- Avoid entering after a move has become overly extended, as late entries can weaken the risk-reward profile.
- Use stop-losses and position sizing to manage risk, since even well-structured momentum trading techniques can produce false signals.
- Wait for price confirmation rather than relying only on indicators.
- If you plan to use an algorithmic trading momentum strategy, consider backtesting it before applying it in live markets.
Why Start Momentum Trading with Admirals?
- Trade with a well-established and reputable company.
- Access the popular MetaTrader platform on PC, Mac, Web, Android, and iOS.
- Upgrade to the Supreme Edition at no extra cost for actionable trading ideas on thousands of stocks and ETFs.
- Open a Trade.MT4 or Trade.MT5 account to trade and take positions in both rising and falling markets.
Start building your momentum trading strategy today by opening a trading account with Admirals.
Continue reading:
- How to find stocks for day trading (step-by-step guide)
- Bollinger Bands trading strategy explained
- How to predict the forex market using technical analysis
Frequently Asked Questions on Momentum Trading Strategy
Do momentum strategies work?
Momentum strategies can work in trending markets where price continues moving in one direction, but performance depends on timing, market conditions, and risk management.
What is the ideal timeframe for momentum trading?
There is no single best timeframe; traders use anything from 1-minute charts (scalping) to daily charts (swing trading), depending on their strategy.
What are the risks of momentum trading?
The main risks include false breakouts, sudden reversals, late entries, and poor risk management in volatile or sideways markets.
About Admirals
Admirals is a multi-award-winning, regulated Forex and CFD broker, offering trading on over 8,000 financial instruments via the world's most popular trading platforms: MetaTrader 4 and MetaTrader 5.
INFORMATION ABOUT ANALYTICAL MATERIALS:
- The given data provides additional information regarding all analysis, estimates, prognosis, forecasts, market reviews, weekly outlooks or other similar assessments or information (hereinafter “Analysis”) published on the websites of Admirals investment firms operating under the Admirals trademark (hereinafter “Admirals”) Before making any investment decisions please pay close attention to the following:
- This is a marketing communication. The content is published for informative purposes only and is in no way to be construed as investment advice or recommendation. It has not been prepared in accordance with legal requirements designed to promote the independence of investment research, and that it is not subject to any prohibition on dealing ahead of the dissemination of investment research.
- Any investment decision is made by each client alone whereas Admirals shall not be responsible for any loss or damage arising from any such decision, whether or not based on the content.
- With view to protecting the interests of our clients and the objectivity of the Analysis, Admirals has established relevant internal procedures for prevention and management of conflicts of interest.
- The Analysis is prepared by an analyst (hereinafter “Author”) with the assistance of AI tools. The Author Amrita Kundu is a contractor for Admirals. This content is a marketing communication and does not constitute independent financial research.
- Whilst every reasonable effort is taken to ensure that all sources of the content are reliable and that all information is presented, as much as possible, in an understandable, timely, precise and complete manner, Admirals does not guarantee the accuracy or completeness of any information contained within the Analysis.
- Any kind of past or modelled performance of financial instruments indicated within the content should not be construed as an express or implied promise, guarantee or implication by Admirals for any future performance. The value of the financial instrument may both increase and decrease and the preservation of the asset value is not guaranteed.
- Leveraged products (including contracts for difference) are speculative in nature and may result in losses or profit. Before you start trading, please ensure that you fully understand the risks involved.