Using Forex Linear Regression to See the Big Picture
This article will discuss a statistical technique known as Linear Regression, and will explain what it is, and how it applies to Forex trading. Additionally, it will cover how to apply the Linear Regression channel indicator in the MetaTrader 4 trading platform, with a step-by-step tutorial that traders can easily follow.

Traders are always looking for methods to apply to the financial markets to provide some element of a trading edge. A trading edge is any trading strategy from which you expect to make a profitable return, if used repeatedly in the long term. Such strategies seek to trade when the odds are skewed in your favour.
One area upon which analysts have focused intently is statistical methods, which have been proven to be effective in other fields, and whether they can beneficially inform trading decisions. As we know, some methods of trading apply only to certain instruments. But here is one of the benefits of regression trading: it favours no single market over another. This is precisely because it is based on general statistical concepts.
Table of Contents
Linear regression trading is a way of trading that you might not be accustomed to. Advanced trading requires advanced knowledge. At Admirals we have vowed to help traders power up their knowledge to help them get closer to achieving their financial goals. Our webinars for advanced traders have been prepared to share information on strategies and indicators that could help you build your financial plan. Click on the banner below to register:

What is Linear Regression?
Linear regression attempts to model the relationship between two variables, with a given collection of data values. The technique attempts to do so by finding a line of 'best fit' between the two. With Forex linear regression trading, the two variables we (as professional traders) are interested in are time and price. Existing data values between the two are plentiful, of course.
By observing the data within a given period: we theoretically gain insight into the future performance, given that we can find a satisfactory line of best fit. This is because the line of best fit is effectively what traders normally refer to as the 'trend'.
If you're new to trading, get an introduction to trends in this free webinar with expert trader and coach, Markus Gabel.
Most trend regression indicators don't stop there, though.
They usually also provide channels that can help indicate support and resistance. They achieve this by tying in probability theory: and by assuming that price values will fall in a normal distribution around this median line. If the prices move a sufficiently significant distance away from the median line, they can be thought of as statistical outliers. At these levels, we might expect to find some form of support or resistance.
So, how do we work out where these price extremes occur? One way is to utilise the statistical concept of a normal distribution, and the accompanying measure of standard deviation. To understand better this standard deviation Forex strategy, let's quickly have a run-through of what we mean by these terms. A normal distribution is a probability distribution that follows a bell-shaped curve, which is represented in the graphic below:
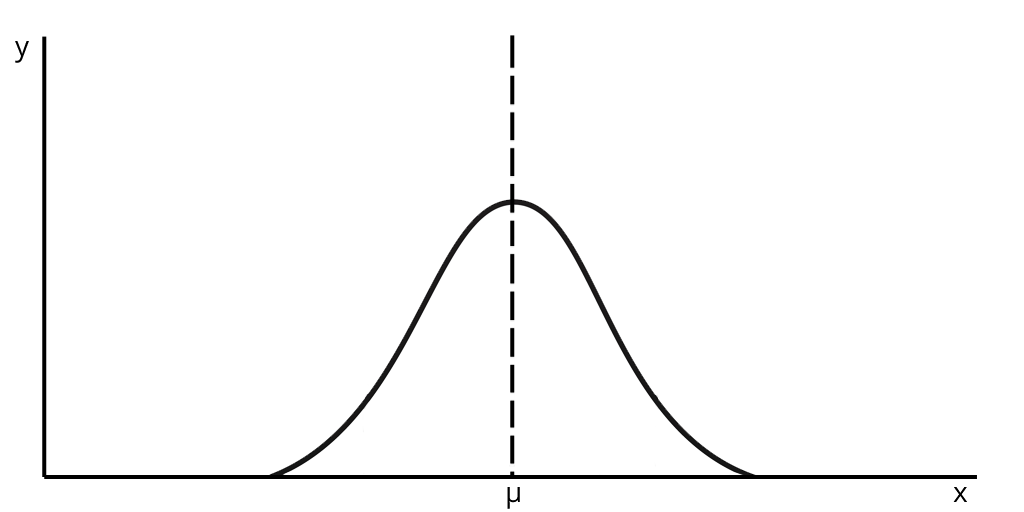
The highest probability density is centred around the mean. This is also the median, and is represented by the dotted line μ in the diagram above. An important point to note is that all normal distributions are symmetrical. This places both the mean and the median at the exact centre of the bell curve.
Standard deviation is another statistical measure, and quantifies how scattered the values are within a data set. The larger the standard deviation, the wider the bell curve. The mathematics that govern this curve are relatively complex. But here's the good news: the concept that it represents is actually fairly simple.
The further we get away from the middle of the bell, the smaller the chances are of those values of X occurring. This means that the majority of values for X occur one standard deviation either side of the mean. In fact, in a normal distribution, we would expect around 68% of the data values to occur in this range.
Two standard deviations either side of the mean cover roughly 95% of all data values. At the tails of the curve, we get the outliers. These are extremely rare occurrences. Now, why does this matter? Well, if we see a data value that is an outlier, it appears to be a fair assumption that future values may regress toward the mean.
Trend channel trading takes these concepts and applies them to market prices. It plots parallel regression lines either side of the line of best fit. These lines give a rule of thumb as to where we might expect to find outlying prices. Let's take a look at using a regression channel indicator in practice with the MetaTrader 4 (MT4) trading platform.
Linear Regression Channel Indicator in MetaTrader 4
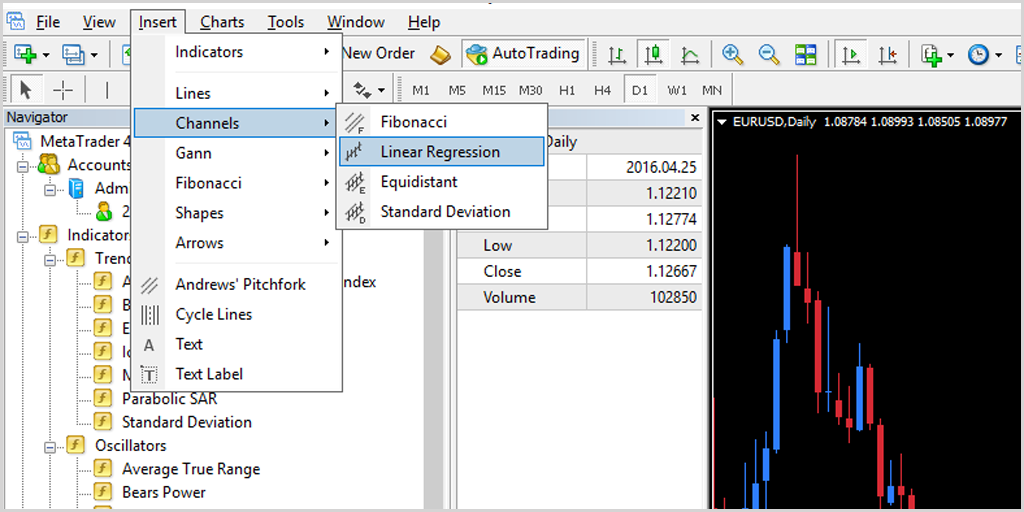
Source: MetaTrader 4 - Selecting the Linear Regression channel Indicator in MetaTrader 4
The Linear Regression channel indicator comes as a standard tool with MetaTrader 4. The image above shows how to select the indicator, via the MT4 'Insert' tab. Note that 'Standard Deviation' is also available as an option.
How to Add The Linear Regression Channel Indicator To A Chart In MT4
To add to your chart once you have selected the MT4 Linear Regression channel, follow these steps:
- Click on the chart where you want to begin your analysis
- Drag to the right until you reach the point you wish to end your analysis
- The linear regression channel automatically appears on the chart between the two points.
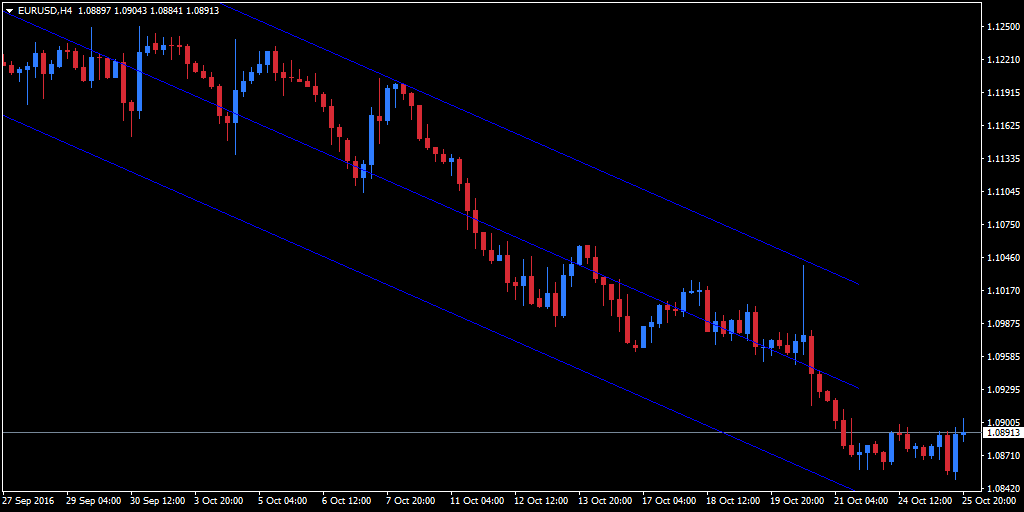
Source: MetaTrader 4 - EUR/USD 4 Hour Chart. Charts for financial instruments in this article are for illustrative purposes and does not constitute trading advice or a solicitation to buy or sell any financial instrument provided by Admirals (CFDs, ETFs, Shares). Past performance is not necessarily an indication of future performance.
The image above displays the regression trend channel, plotted as blue dotted lines, on a EUR/USD four-hour chart. The median line is the line of best fit for the closing prices contained within the selected period. The trend lines above and below are at equal distances from the median line.
They are parallel, and represent one standard deviation from the median line. The rules for trading the regression channel are fairly simple. The strategy revolves around the expectation that once the price moves out to an outlying level, there is a good chance that it will revert to the median line. Therefore, the upper line represents resistance, while the lower line represents support.
The best fit line suggests the trend. So a suggested method of using this indicator is to assume trend continuation, and then trade in the direction of the trend. While that trend persists, we can think of the median line as being a kind of equilibrium point. Obviously, this kind of median line trading is susceptible to breakouts that result in a new trend forming.
Anytime the price breaks out beyond the channel should be treated with caution. An extended period beyond the channels suggests a new trend may be forming. This is why you must be careful with trend analysis regression and ensure that you are disciplined with your risk management. Now it should also be pointed out that you are not limited to using only a single regression channel. If we select standard deviation, we can add lines that are a multiple number of standard deviations away from the median. To do this:
- We first draw our channels in exactly the same way as we did with the linear regression tool. This plots the channels one standard deviation away, exactly as before.
- We then need to edit the parameters of the tool.
- We do this by selecting 'chart', 'objects', and then the 'objects' list.
- Then, in the objects list, we select 'StdDev Channel' and then 'Edit'.
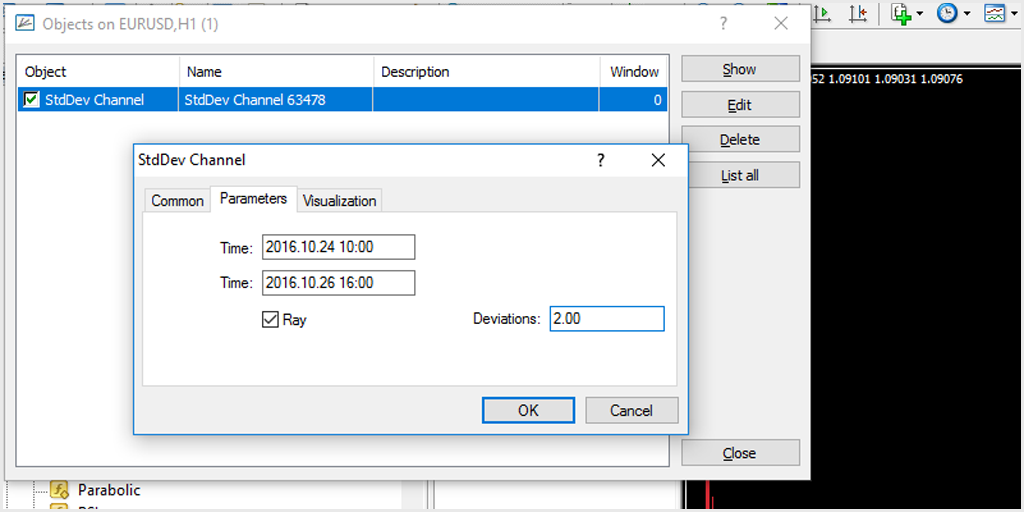
Source: MetaTrader 4 screenshot - selecting the parameters in a EUR/USD 1 Hour Chart
In the image above, the value of deviations equals 2.00. Additionally, the 'Ray' checkbox is ticked, which causes the lines to extend infinitely to the right of the chart. It now adds a second regression channel, with lines two standard deviations either side of the median line.
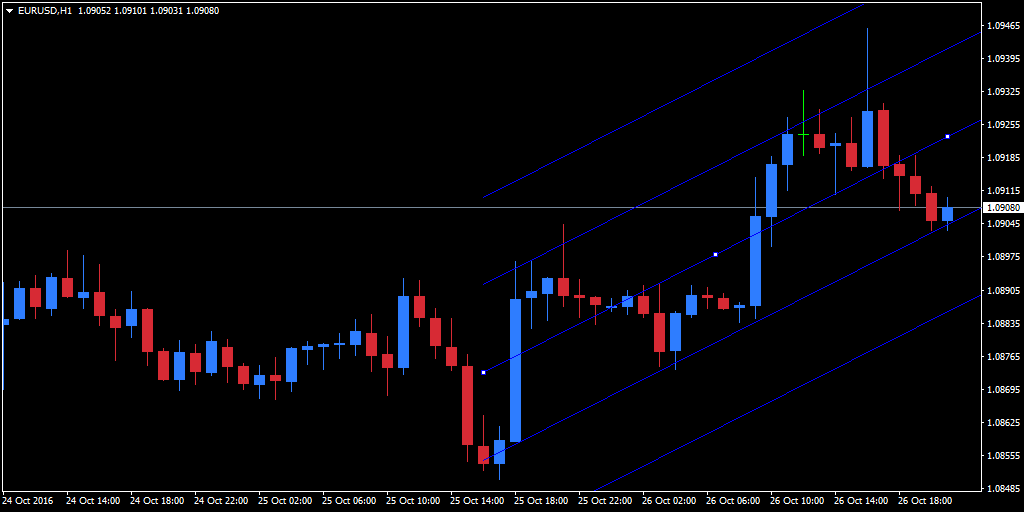
Source: MetaTrader 4 - EUR/USD 1 Hour Chart. Charts for financial instruments in this article are for illustrative purposes and does not constitute trading advice or a solicitation to buy or sell any financial instrument provided by Admirals (CFDs, ETFs, Shares). Past performance is not necessarily an indication of future performance.
We can also draw smaller channels within a larger one in order to identify smaller trends within the overall larger trend. If you're interested in exploring regression trading further, there are other, more complex versions with which you can experiment. Moving Average regression and polynomial regression Forex analysis are just a couple of examples.
Correspondingly, moving linear regression indicators and polynomial regression channels are analysis tools that would involve the areas mentioned above. You can download custom indicators in MetaTrader 4 that cover these more advanced versions. For an even greater selection of cutting-edge tools, why not try out the MetaTrader 4 Supreme Edition plugin? It's the ultimate plugin for MT4, with its own package of indicators and a wealth of trading aids. Additionally, the Supreme Edition plugin is also available for MetaTrader 5.
Final Thoughts on Linear Regression Forex Trading
At its heart, linear regression is a method of estimating the undefined relationship between price and time. As a final rule of thumb: it's always sensible with technical analysis to try and confirm your thinking with a second-look method. For example, the image below contains the Commodity Channel Index as a confirming indicator.
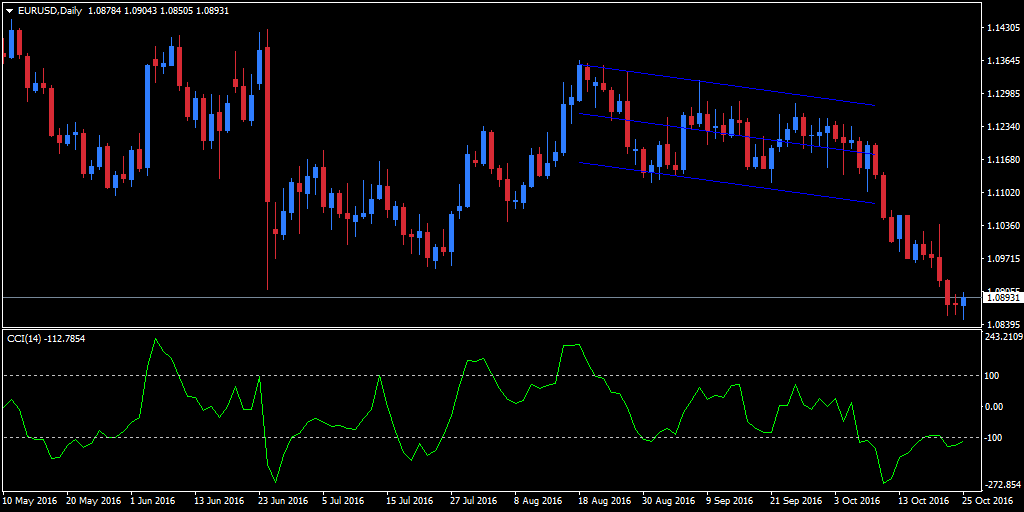
Source: MetaTrader 4 - EUR/USD Daily Chart with a CCI attached as a confirming indicator. Charts for financial instruments in this article are for illustrative purposes and does not constitute trading advice or a solicitation to buy or sell any financial instrument provided by Admirals (CFDs, ETFs, Shares). Past performance is not necessarily an indication of future performance.
If you want to try out linear regression trading without any risk, a demo trading account is a good place to experiment, because you can trade with real market prices and data, trading with virtual funds, instead of putting your capital at risk. This is good for testing out general trading strategies too, before you apply them in the live markets.
Regression channels are just one type of trend channel trading system. There are many other popular types of trend channel analysis that you can use, such as Keltner channels and Donchian channels. Another way of confirming your technical analysis linear regression signals is by looking at multiple time frames. Looking at the same channels on a longer timeframe may reveal aspects you hadn't noticed before.

About Admirals
Admirals is a multi-award winning, globally regulated Forex and CFD broker, offering trading on over 8,000 financial instruments via the world's most popular trading platforms: MetaTrader 4 and MetaTrader 5. Start trading today!
This material does not contain and should not be construed as containing investment advice, investment recommendations, an offer of or solicitation for any transactions in financial instruments. Please note that such trading analysis is not a reliable indicator for any current or future performance, as circumstances may change over time. Before making any investment decisions, you should seek advice from independent financial advisors to ensure you understand the risks.
Frequently Asked Questions (FAQ) On Linear Channel Indicator
What is linear regression in forex?
At its heart, linear regression is a method of estimating the undefined relationship between price and time.
How can I find and use the Linear Regression channel indicator?
The Linear Regression channel indicator comes as a standard tool with MetaTrader 4 platform available for Admirals' traders.
Other articles you may find interesting:
- How to Use a Forex Hedging Strategy
- Learn the 1 Minute Forex Scalping Strategy
- How to Create a Pair Trading Strategy