5 Top Forex Trading Strategies Explained
A Forex trading strategy is a set of objective rules that define when traders enter and exit positions, how to size trades and how to manage risk. Whilst no strategy can guarantee success, a well-defined approach allows traders to make consistent, informed decisions over time.
This guide is designed to provide an overview of several commonly used Forex trading strategies across different timeframes and trading styles. We’ll also explain how traders can choose and evaluate a Forex trading strategy.
The information in this article is provided for educational purposes only and does not constitute financial advice. Consult a financial advisor before making investment decisions.

Table of Contents
- How Traders Choose a Forex Trading Strategy
- Types of Forex Trading Strategies
- Examples of Forex Trading Strategies Traders Use
- How Traders Evaluate Forex Trading Strategies
- Backtesting and Forward Testing Forex Trading Strategies
- Forex Trading Strategy Workflow
- Common Mistakes When Using Forex Trading Strategies
- Final Thoughts on Forex Trading Strategies
- FAQs on Forex Trading Strategies
How Traders Choose a Forex Trading Strategy
Different Forex trading strategies can operate on different timeframes and respond to different types of market behaviour. Because of this, traders select strategies based partly on practical considerations such as time availability, preferred chart timeframe and the type of market conditions they are analysing.
Time Availability
Some strategies require continuous monitoring of the market. For example, scalping and certain intraday approaches involve watching price movements closely throughout the trading session. Other approaches, such as swing trading, typically require less time spent analysing charts.
Preferred Timeframe
Forex strategies can operate on a wide range of chart timeframes. Short-term approaches may focus on 1-minute to 15-minute charts, whilst swing trading strategies more commonly use 4-hour or daily charts.
Market Conditions
Certain strategies attempt to identify opportunities in trending markets, whilst others focus on periods where prices move within a defined range. Consequently, traders often adapt the strategies they use depending on whether the market appears to be trending or consolidating.
Risk Management Preferences
Different strategies may involve different stop-loss distances, trade frequency and holding periods. These factors can influence how traders approach position sizing and risk exposure.
Types of Forex Trading Strategies
Every approach to trading has its own characteristics, tools and typical holding periods. Understanding these differences can help you choose a strategy that aligns with your trading style.
Below are four different types of strategies across different timeframes. These describe broad trading styles; we’ll look later at examples of specific strategies within those styles.
- Scalping: Involves making very short-term trades, possibly lasting just minutes, to take advantage of small price movements. Scalpers use low timeframe charts, relying on speed, discipline and precise execution. Scalping is considered a very advanced trading style and may not be suitable for most traders.
- Day Trading: Focuses on intraday market moves, with positions typically closed by the end of the trading day. This approach avoids overnight risk whilst allowing traders to react to short-term patterns.
- Swing Trading: Aims to capture price swings over several days. Swing traders often use 4-hour or daily charts to identify patterns and trends.
- Position Trading: Focuses on long-term market trends and typically operates from weekly or monthly charts. Positions may be held for weeks or even months, and traders combine technical and fundamental analysis to attempt to identify major shifts in the market.
Examples of Forex Trading Strategies Traders Use
Below are examples of five commonly used Forex trading strategies across different timeframes and styles. Each example outlines how the strategy works, including potential entry logic and risk considerations.
Please note this content is for educational purposes only. The example strategies described have not been tested in live market conditions.
1. Intraday Breakout Strategy
This strategy focuses on identifying a rangebound market and entering when price breaks beyond a defined level of support or resistance.
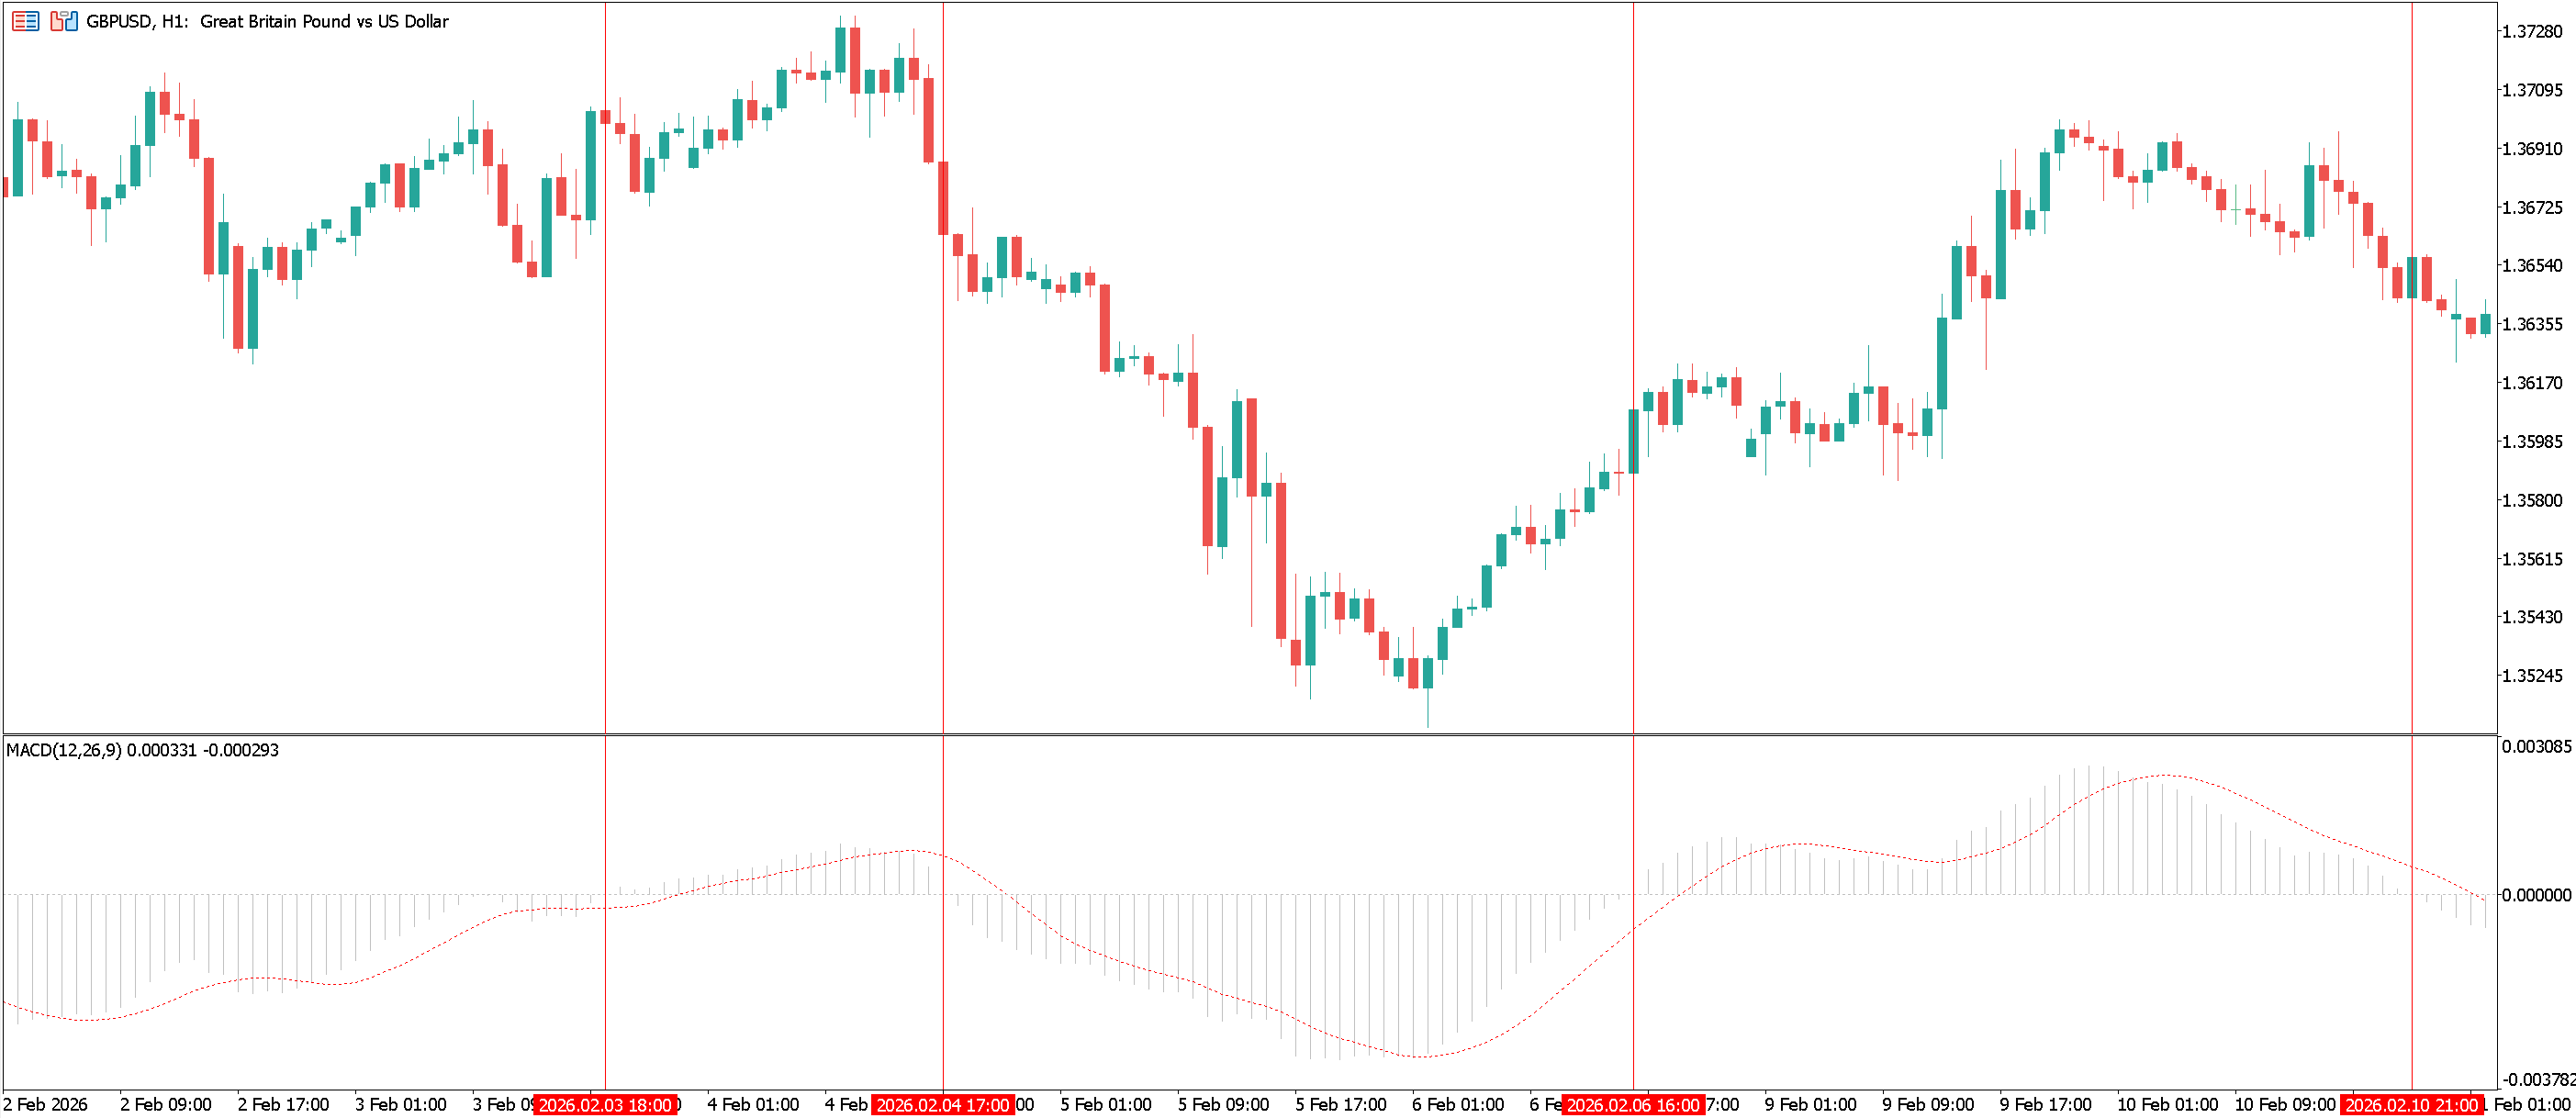
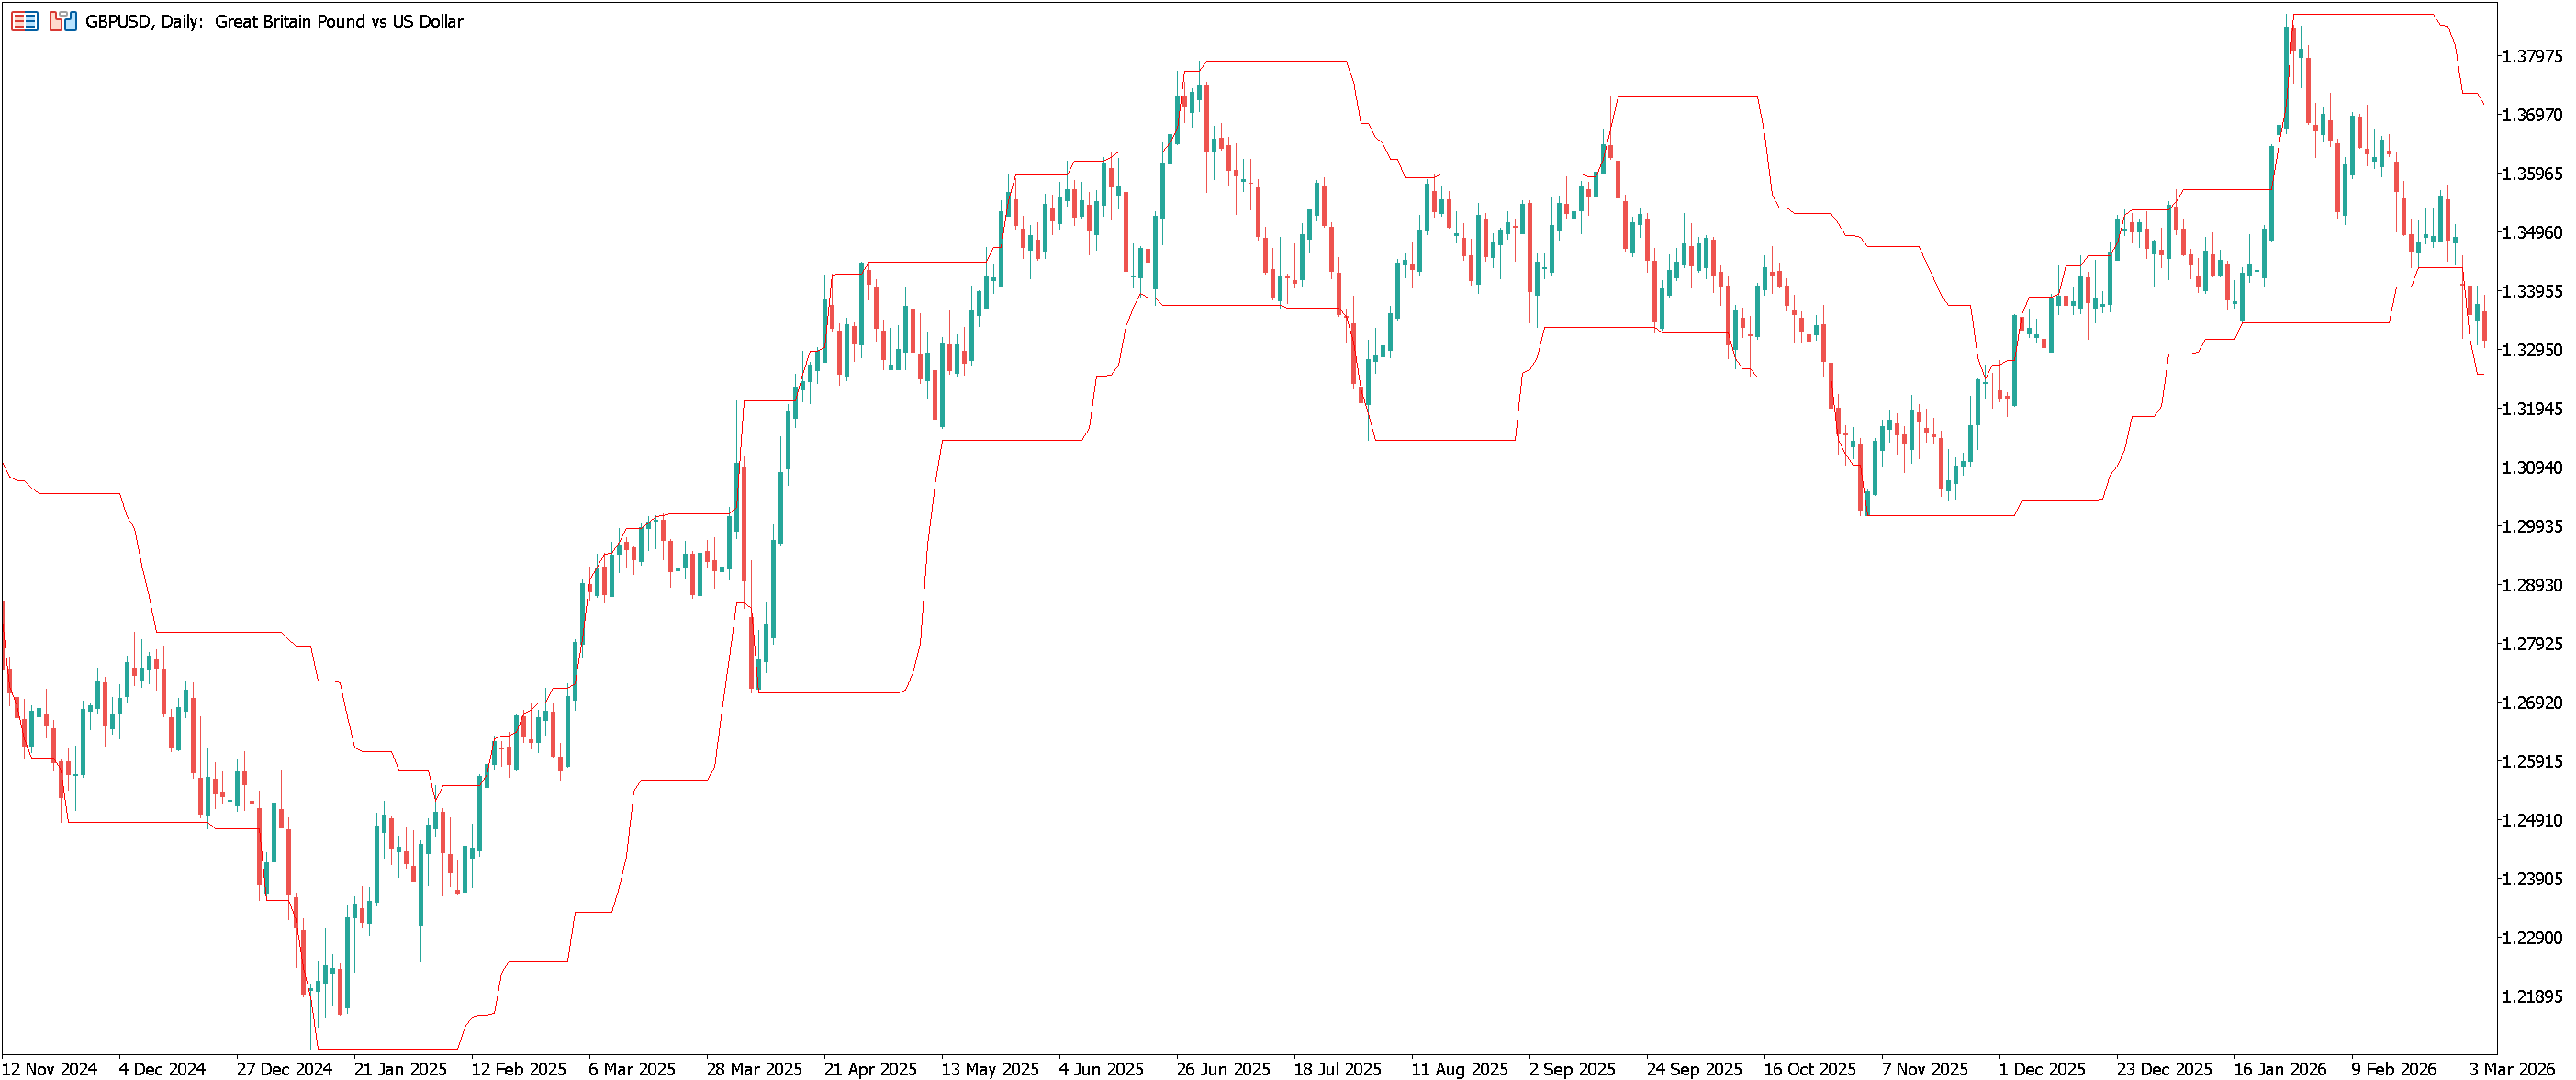
2. MACD 1-Hour Momentum Strategy
This strategy uses the MACD indicator on the 1-hour chart to identify momentum shifts.
| How It Works: |
|
|---|---|
| Entry Logic: |
|
| Risk Management: |
|
| Considerations: |
|
Below is an hourly chart of GBPUSD with the MACD indicator added. The vertical red lines indicate instances where the histogram is crossing the zero line.
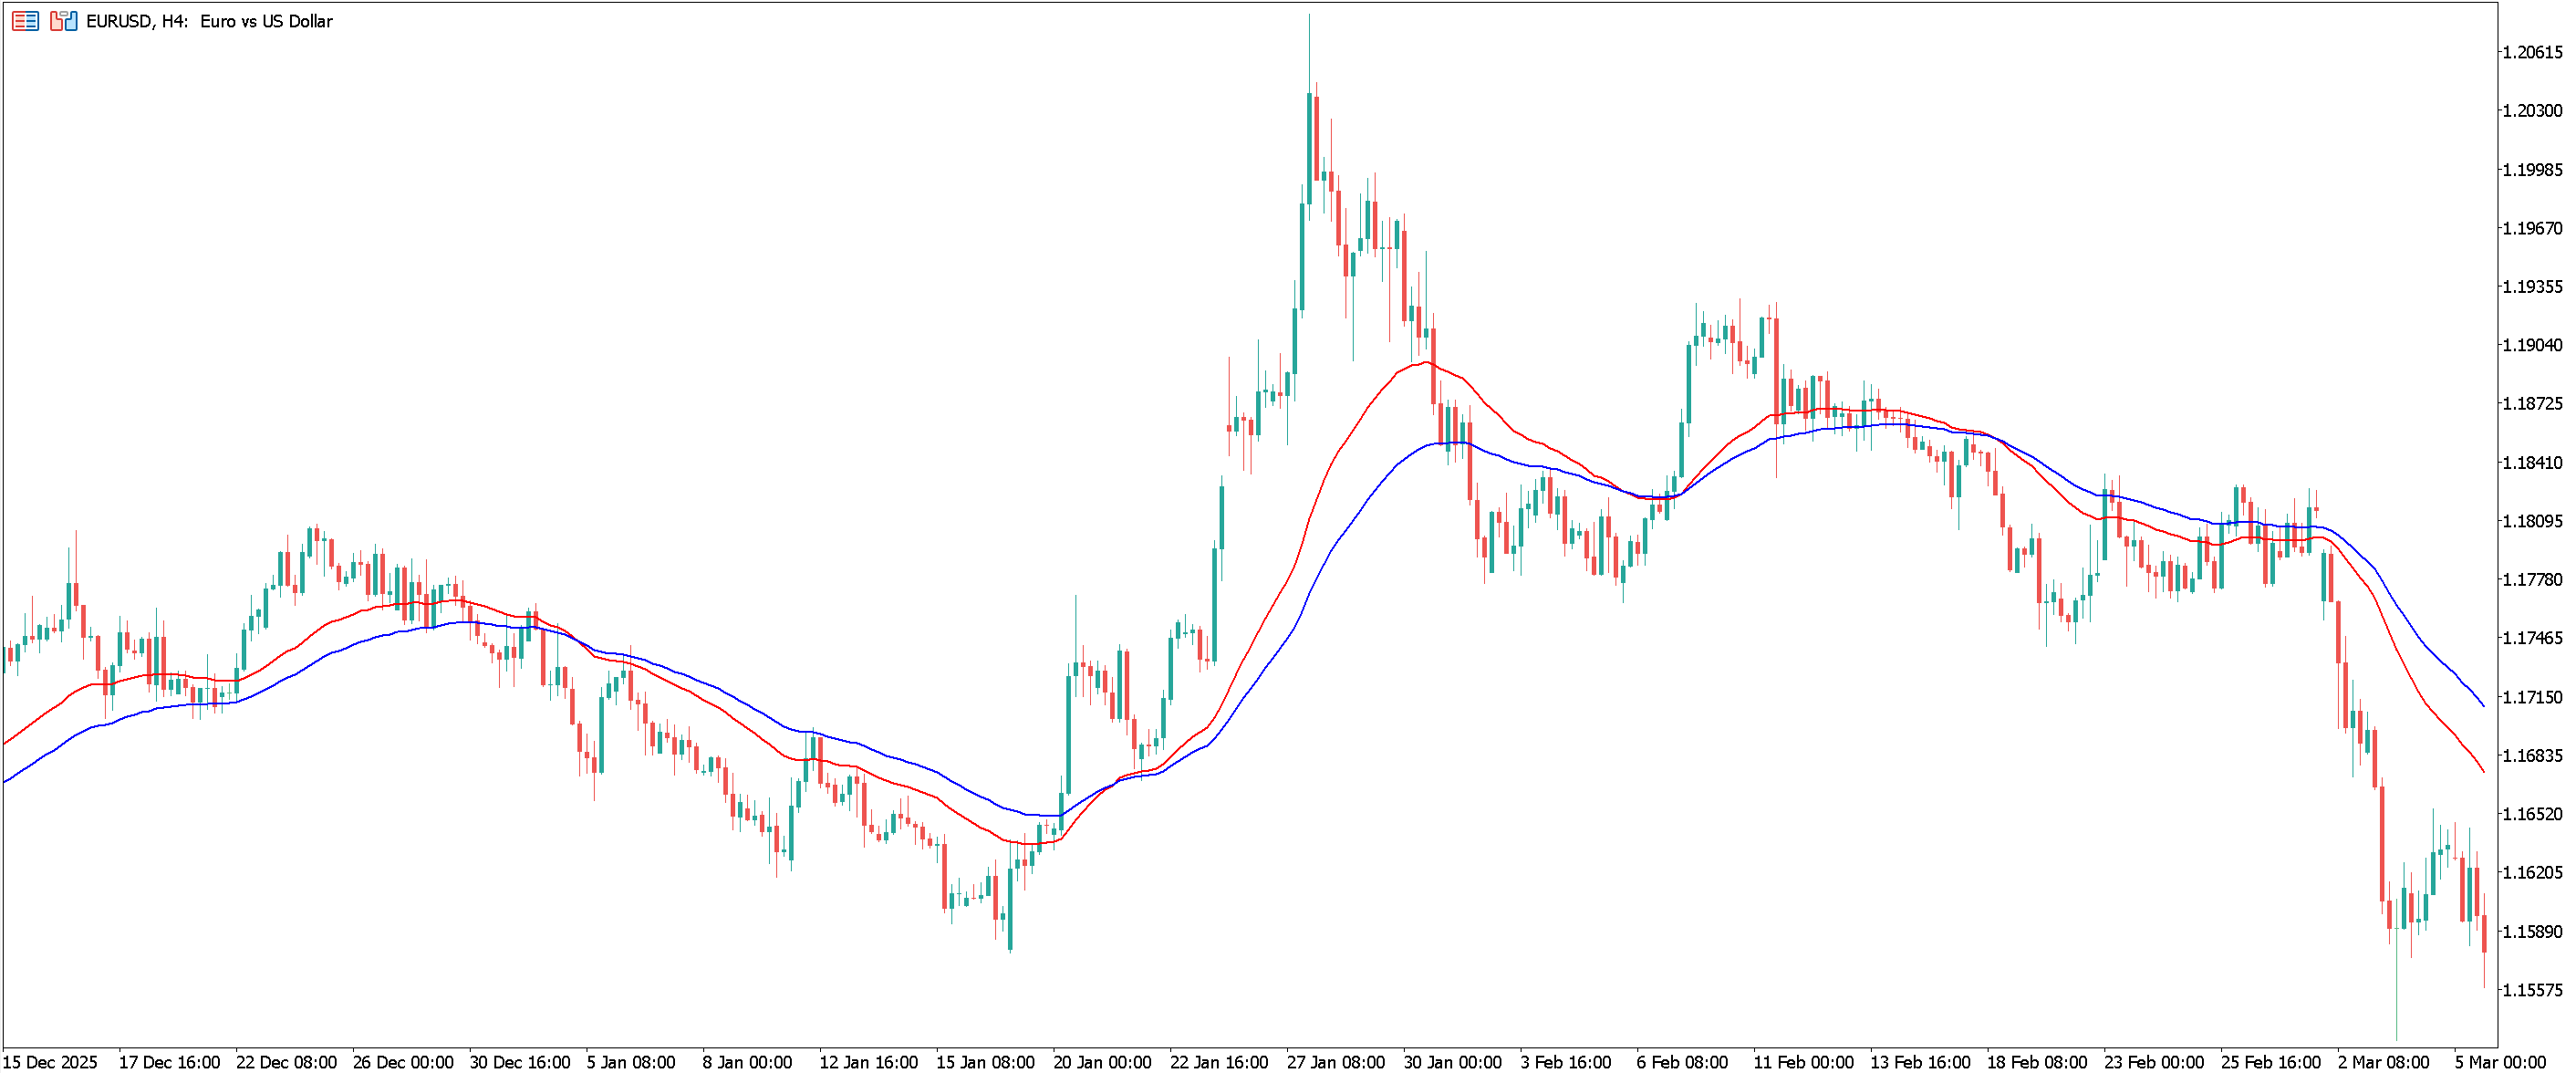
3. 4-Hour EMA Trend Strategy
This swing trading strategy uses Exponential Moving Averages (EMAs) to identify directional bias.
| How It Works: |
|
|---|---|
| Entry Logic: |
|
| Risk Management: |
|
| Considerations: |
|
Below is the four-hour chart of EURUSD with a 34 EMA (red) and 55 EMA (blue) added.
4. Mean Reversion (Range Trading) Strategy
This strategy aims to trade within established support and resistance boundaries.
| How It Works: |
|
|---|---|
| Entry Logic: |
|
| Risk Management: |
|
| Considerations: |
|
5. Donchian Channel Trend Strategy
This strategy uses Donchian Channels to identify breakouts based on new highs or lows.
| How It Works: |
|
|---|---|
| Entry Logic: |
|
| Risk Management: |
|
| Considerations: |
|
Forex Strategy Comparison (Quick Reference)
How Traders Evaluate Forex Trading Strategies
Understanding how a strategy generates signals is only part of the process; equally important is knowing how to evaluate whether the approach is right for you.
Traders who understand concepts such as risk-reward, expectancy and drawdown are better positioned to assess whether a strategy aligns with their objectives and risk tolerance.
1. Risk-Reward Ratio
The risk-reward ratio compares how much capital is risked on a trade relative to the potential reward.
For Example:
- If you risk 50 pips to target 100 pips, the risk-reward ratio is 1:2
- If you risk 30 pips to target 30 pips, the ratio is 1:1
A higher risk-reward ratio means that average winning trades are likely to be larger than average losing trades. However, this does not mean the strategy will perform better overall; the win rate must also be considered.
Bear in mind that no fixed ratio guarantees outcomes. It is one variable within a broader evaluation process.
2. Expectancy
Expectancy measures the average outcome you can expect per trade over a large sample size.
The simplified formula is:
Expectancy = (Win Rate × Average Win) − (Loss Rate × Average Loss)
For example:
- Win rate: 50%
- Average win: 2R
- Average loss: 1R
Expectancy = (0.5 × 2) − (0.5 × 1)
Expectancy = 1 − 0.5 = 0.5R
“R” represents the amount of capital risked on a single trade (based on stop-loss distance).
Consequently, in this example, the strategy would have averaged +0.5R per trade over the sample period.
Key Points:
- A high win rate alone does not mean a strategy is sustainable.
- A lower win rate can still produce positive expectancy if average wins are larger than losses.
- Expectancy becomes meaningful only after a sufficient number of trades.
3. Drawdown
Drawdown measures the largest decline in account value a strategy experiences before it recovers (i.e. the decline from a peak to a subsequent low).
When evaluating a Forex strategy, drawdown helps you understand how much your capital might fluctuate whilst using the strategy.
For example:
- Account grows from £10,000 to £12,000
- It then falls to £9,500
- The drawdown is £2,500 (or approximately 20.8%)
Drawdown matters because:
- It reflects volatility of returns
- It affects psychological pressure
- It helps determine whether a strategy fits your risk tolerance
Two strategies might have similar long-term results, but one may dip sharply during losing streaks while the other moves more smoothly. Knowing this helps you decide if you could realistically follow the strategy without deviating from your plan under pressure.
4. Sample Size
One common mistake when evaluating a strategy is drawing conclusions from too few trades.
For Example:
- 5 winning trades do not validate a strategy
- 5 losing trades do not invalidate one
Strategies should ideally be assessed over dozens of trades at minimum. Larger sample sizes reduce randomness and provide a clearer picture of its true performance.
Backtesting and Forward Testing Forex Trading Strategies
Before applying a trading strategy in live market conditions, traders typically test the strategy to better understand how it behaves in different market conditions. Two commonly used approaches are backtesting and forward testing.
Testing helps traders move from theoretical ideas to a more structured evaluation process. By combining historical analysis with real-time observation, traders can better understand how a strategy behaves across different market conditions.
These testing methods do not guarantee future results, but they can help traders assess how a strategy might perform over time.
Backtesting
Backtesting involves applying the rules of a trading strategy to historical market data to see how the strategy would have performed in past conditions.
This can be done in two ways:
- Manual backtesting: Reviewing historical charts and recording hypothetical trades based on the strategy’s rules.
- Platform-based testing: Using trading platform tools, such as strategy testers, to simulate trades automatically.
Backtesting can help traders:
- Understand how the strategy behaves across different market phases
- Identify potential drawdowns or losing streaks
- Refine entry, exit and risk management rules
However, it is important to remember that past performance is not a reliable indicator of future results. Furthermore, backtesting cannot fully replicate real trading conditions such as spreads, slippage, execution delays or emotional decision-making.
Forward Testing
Forward testing involves applying a strategy in realistic market conditions to see how it performs going forward.
This is commonly done using either:
- Demo trading accounts: where trades are placed with virtual funds; or
- Small live accounts: where traders allocate limited capital to help evaluate the strategy.
Forward testing allows traders to assess some of the factors that are difficult to capture in backtesting, including:
- Real-time market volatility
- Execution speed and spreads
- Psychological discipline when following the strategy’s rules
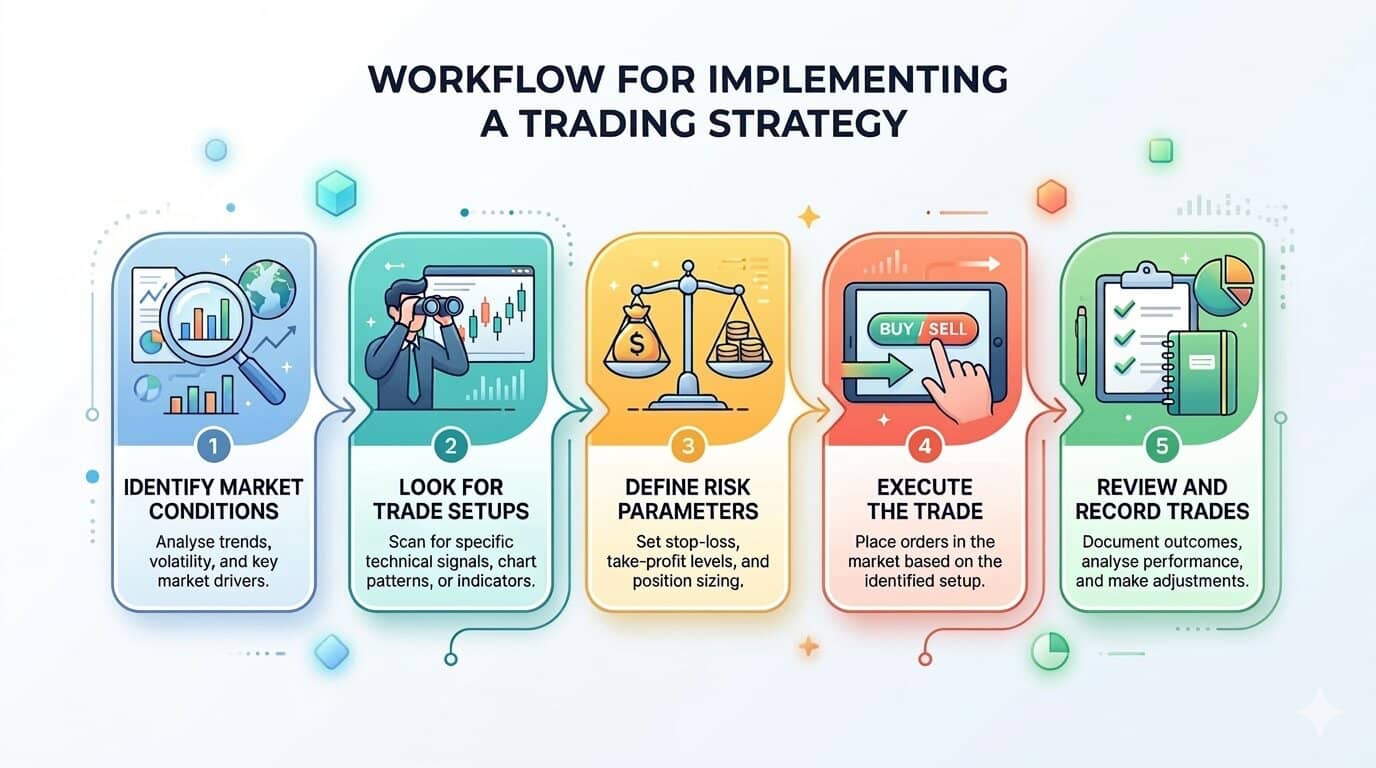
Forex Trading Strategy Workflow
Once a trading strategy has been defined and tested, traders often follow a structured workflow to apply it consistently. A clear process can help reduce impulsive decisions and ensure that trades are taken according to the strategy’s predefined rules rather than emotions.
Below is an example of a simplified workflow that many traders use when applying a Forex trading strategy.
1. Identify Market Conditions
The first step is to assess the broader market environment. Traders typically look for conditions that match the strategy they’re using.
For example:
- Trend-following strategies require markets to be moving in a clear direction.
- Mean reversion strategies are typically considered when price appears to be moving within a range.
Identifying the appropriate environment helps traders avoid applying their strategy in unsuitable conditions.
2. Look for Trade Setups
Once the market context has been identified, traders look for setups that match the rules of their strategy.
This might include signals such as:
- Indicator crossovers
- Price reaching support or resistance levels
- Breakouts from consolidation zones
- Specific candlestick patterns
3. Define Risk Parameters
Before entering a trade, traders typically define how much risk they are willing to take.
This may include:
- Setting a stop-loss level
- Determining a profit target
- Calculating position size based on account size and risk tolerance
Establishing these parameters in advance helps ensure that risk management remains consistent from trade to trade.
4. Execute the Trade
If the setup meets the strategy rules and risk parameters are defined, the trade can be executed according to the plan.
Execution may involve:
- Entering a market order immediately
- Placing pending orders at specific price levels
- Waiting for confirmation signals before entry
5. Review and Record Trades
After a trade is closed, many traders review the outcome and record it in a trading journal.
Typical information recorded includes:
- Entry and exit prices
- Stop-loss and take-profit levels
- Market conditions at the time of the trade
- Observations about execution or discipline
Over time, this information can help traders identify patterns in their decision-making and refine their strategy rules.
Common Mistakes When Using Forex Trading Strategies
- Testing on too-small samples or overfitting historical data.
- Changing rules after a few losing trades rather than following a plan.
- Ignoring risk management and using inconsistent position sizing.
- Applying trend strategies in ranging markets, and vice versa.
- Failing to record and review trades in a journal.
Final Thoughts on Forex Trading Strategies
Forex trading strategies provide a structured framework for analysing the market and identifying potential trading opportunities. Rather than relying on instinct, experienced traders use clearly defined rules to guide when trades are opened and closed.
The strategy examples outlined in this guide illustrate some of the different ways traders can approach the Forex market. Each approach operates on different timeframes and relies on different types of analysis, which means suitability can vary depending on the individual trading style and market conditions.
Before applying any strategy in live markets, many traders spend time evaluating the rules through backtesting and forward testing. This process can help highlight how a strategy behaves across different market environments and whether its rules are applied consistently.
It is also important to remember that financial markets are dynamic. A strategy that behaves one way in a particular period may behave differently as conditions change. For this reason, ongoing review and disciplined risk management are important elements when implementing Forex trading strategies.
Other Articles You Might Be Interested In:
FAQs on Forex Trading Strategies
What is a Forex trading strategy?
A Forex trading strategy is a structured set of rules used to analyse currency markets and identify potential trading opportunities. These rules typically define when to enter a trade, where to place stop-losses and when positions should be exited.
What are the main types of Forex trading strategies?
Forex trading strategies are often grouped by time horizon and market approach. Common categories include scalping, day trading, swing trading, trend-following strategies and mean reversion strategies. Different approaches may operate on different timeframes and uses different types of market signals.
What timeframe is commonly used for Forex trading strategies?
Forex strategies can operate on a wide range of timeframes. Short-term approaches such as scalping may use 1-minute to 15-minute charts, whereas day trading often uses 15-minute to 1-hour charts. Swing trading strategies commonly use 4-hour or daily charts.
How do traders evaluate a Forex trading strategy?
Traders often evaluate a strategy by analysing several metrics, such as risk-reward ratio, win rate, maximum drawdown, and overall expectancy. These metrics help assess how the strategy has behaved historically and how consistently its rules can be applied.
How is expectancy calculated in trading?
Expectancy measures the average outcome per trade over a large sample. A common formula is:
Expectancy = (Win Rate × Average Win) − (Loss Rate × Average Loss)
This calculation can help traders understand whether a strategy has historically produced positive or negative average outcomes across many trades.
How many trades are typically needed to evaluate a strategy?
The number of trades required depends on how frequently a strategy generates signals. High-frequency intraday strategies may require hundreds of trades to build a meaningful sample size, whilst slower swing trading approaches may be analysed over longer historical periods with fewer signals.
What is backtesting in Forex trading?
Backtesting is the process of applying a trading strategy to historical market data to observe how its rules would have performed in past market conditions. This helps traders assess whether the strategy behaves consistently before applying it in the live markets.
What is forward testing in Forex trading?
Forward testing involves applying a strategy in realistic market conditions, often using a demo account or small live account. This stage allows traders to observe how the strategy performs with live price movements, spreads and execution conditions.
INFORMATION ABOUT ANALYTICAL MATERIALS:
The given data provides additional information regarding all analysis, estimates, prognosis, forecasts, market reviews, weekly outlooks or other similar assessments or information (hereinafter “Analysis”) published on the websites of Admirals investment firms operating under the Admirals trademark (hereinafter “Admirals”) Before making any investment decisions please pay close attention to the following:
- This is a marketing communication. The content is published for informative purposes only and is in no way to be construed as investment advice or recommendation. It has not been prepared in accordance with legal requirements designed to promote the independence of investment research, and that it is not subject to any prohibition on dealing ahead of the dissemination of investment research.
- Any investment decision is made by each client alone whereas Admirals shall not be responsible for any loss or damage arising from any such decision, whether or not based on the content.
- With view to protecting the interests of our clients and the objectivity of the Analysis, Admirals has established relevant internal procedures for prevention and management of conflicts of interest.
- The Analysis is prepared by an analyst (hereinafter “Author”) with the assistance of AI tools. The Author Roberto Rivero is a contractor for Admirals. This content is a marketing communication and does not constitute independent financial research.
- Whilst every reasonable effort is taken to ensure that all sources of the content are reliable and that all information is presented, as much as possible, in an understandable, timely, precise and complete manner, Admirals does not guarantee the accuracy or completeness of any information contained within the Analysis.
- Any kind of past or modelled performance of financial instruments indicated within the content should not be construed as an express or implied promise, guarantee or implication by Admirals for any future performance. The value of the financial instrument may both increase and decrease and the preservation of the asset value is not guaranteed.
- Leveraged products (including contracts for difference) are speculative in nature and may result in losses or profit. Before you start trading, please ensure that you fully understand the risks involved.