What Is Grid Trading? A Forex Guide to Types, Examples & Bot Setup
Most forex strategies depend on predicting where price is heading. Grid trading takes a different approach, one built around structure rather than forecasting. It may suit choppy or range-bound markets, though it is not passive and carries risk.
In this guide, we cover everything about grid trading, what is grid trading in forex, how does a grid trading bot work, the three main types of grid trading strategy with practical examples, and what to consider before putting one into practice.
The information in this article is provided for educational purposes only and does not constitute financial advice. Consult a financial advisor before making investment decisions.
.png)
Table of Contents
What is Grid Trading?
The approach tends to appeal to traders who prefer a rule-based, systematic style. Some traders also use a dynamic grid trading strategy, where grid spacing adjusts automatically based on volatility, rather than remaining fixed. This approach is more common in EA-based setups.
Because orders are pre-placed, there is less need for constant monitoring once the grid is active, though it does require careful upfront planning around grid spacing, capital allocation, and risk management.
How Does Grid Trading Work?
The mechanics are easier to follow with an example of grid trading using actual numbers. Suppose EURUSD is trading at 1.1050. A trader sets up an arithmetic grid with 20-pip spacing and two levels on each side.
If price drops to 1.1030, the buy limit fills. If it then recovers to 1.1050, a sell limit closes the position, capturing a 20-pip potential gain on that cycle. The grid keeps operating across multiple oscillations as long as price stays within the defined range.
Each completed cycle may produce a small, defined potential gain or loss. The strategy does not rely on one large move; it may accumulate profit or loss from repeated smaller oscillations.
How to Start Grid Trading in Forex
- Identify whether the market is trending or ranging.
- Select the appropriate grid type (trend-following, range, or hedged).
- Define the grid spacing based on market volatility.
- Set position size and maximum exposure limits.
- Place pending orders at each grid level.
- Define stop-loss rules.
- Monitor performance and adjust the grid if market conditions change.
3 Grid Trading Strategies Explained (With Examples)
Each of the three main types of grid trading is designed for a different market environment. In the grid trading strategy explained below, the most important decision is matching the grid type to the right conditions, as the structure of the grid follows from that assessment, not the other way around.
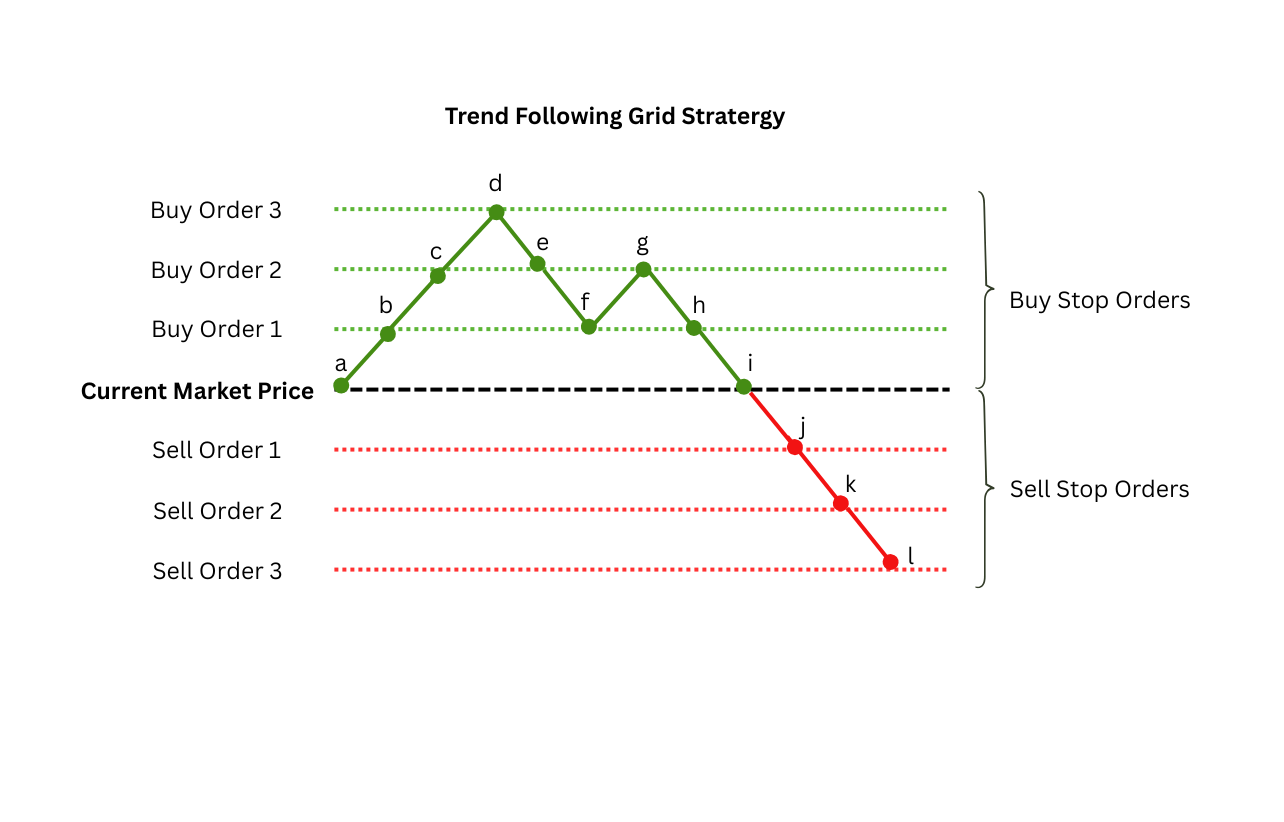
1. Trend Following Grid Trading Strategy
The trend-following grid aligns trades with the prevailing direction. A trader places a series of buy or sell stop orders at predefined intervals, for example, every 30 or 50 pips, above and below the current price. As price moves one way, these orders trigger and gradually build a larger position in line with the trend's momentum. If the market reverses sharply or turns choppy, positions built in the wrong direction may lead to losses, so knowing when to take profit or exit tends to matter as much as the entry.
Here’s a chart for your reference.
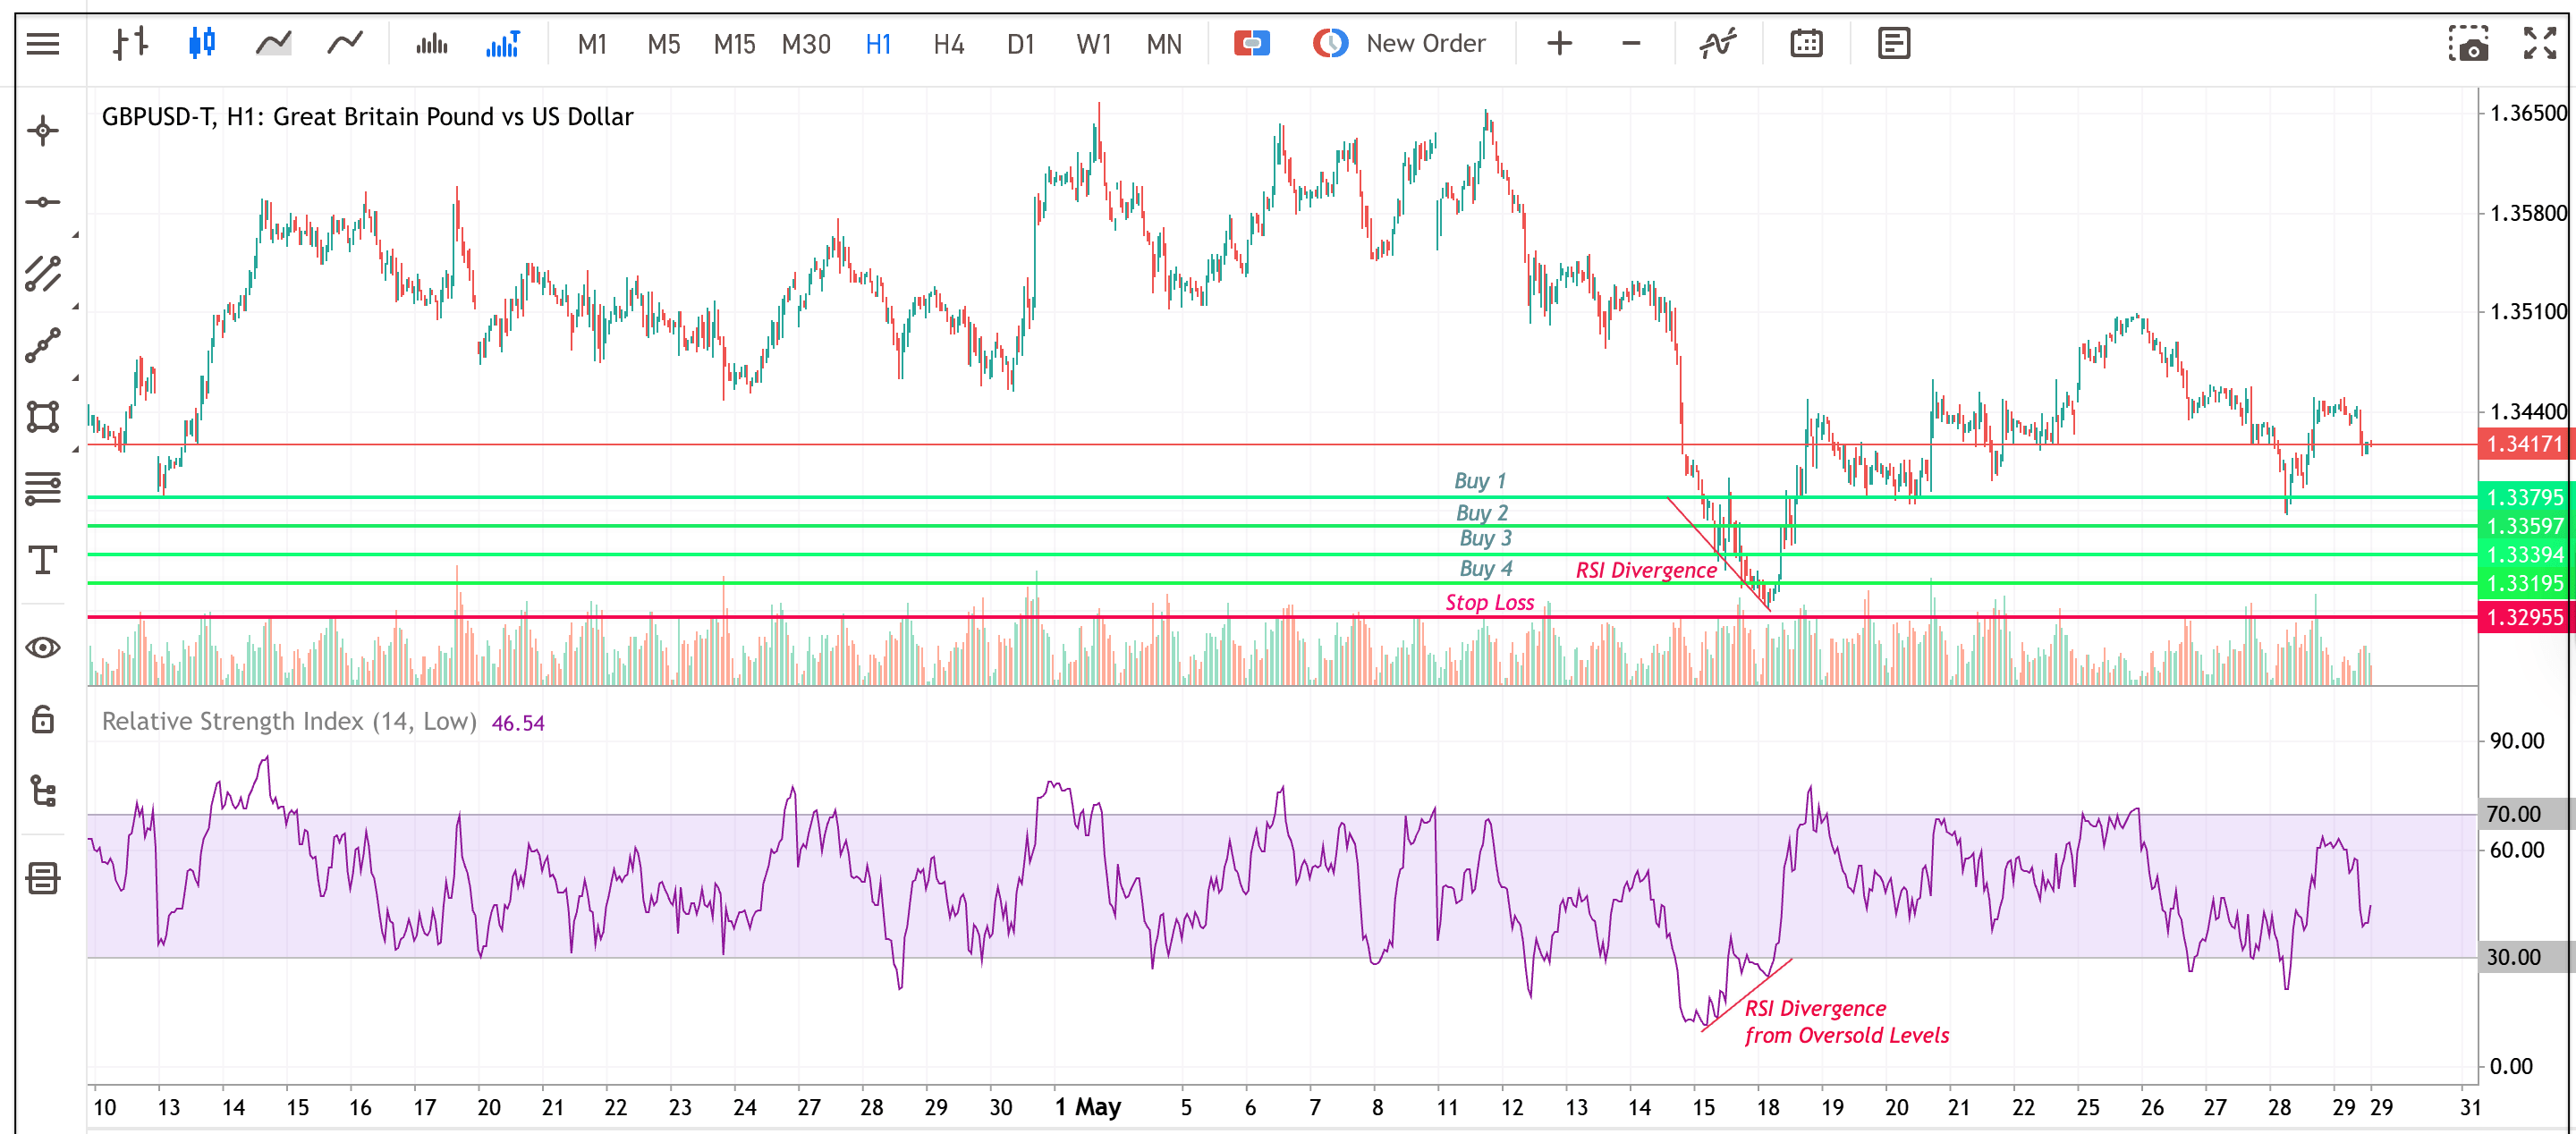
Practical Example of a Trend Following Grid on GBPUSD Currency Pair
On a GBPUSD H1 chart, price had declined toward a prior swing low while RSI formed a bullish divergence from oversold territory. Some analysts treat this as a possible sign of momentum exhaustion, though it does not guarantee a reversal.
In this example of grid trading, the first buy order was placed at the swing-low area, with additional buys layered at roughly 20-pip intervals below it and a stop loss below the lowest level to define maximum risk. Fixed targets were set near a prior resistance area, with a trailing stop as an alternative if momentum continued.
2. Range Grid Trading Strategy
Where the trend-following grid rides a directional move, the range grid trading strategy responds to sideways markets by opening positions near support and resistance. Price typically fluctuates between a defined resistance level and a support level, and the approach traders often use is to buy low and sell high repeatedly within that band. Managing a grid trading strategy with stop loss placement outside the range boundaries tends to be treated as essential rather than optional.
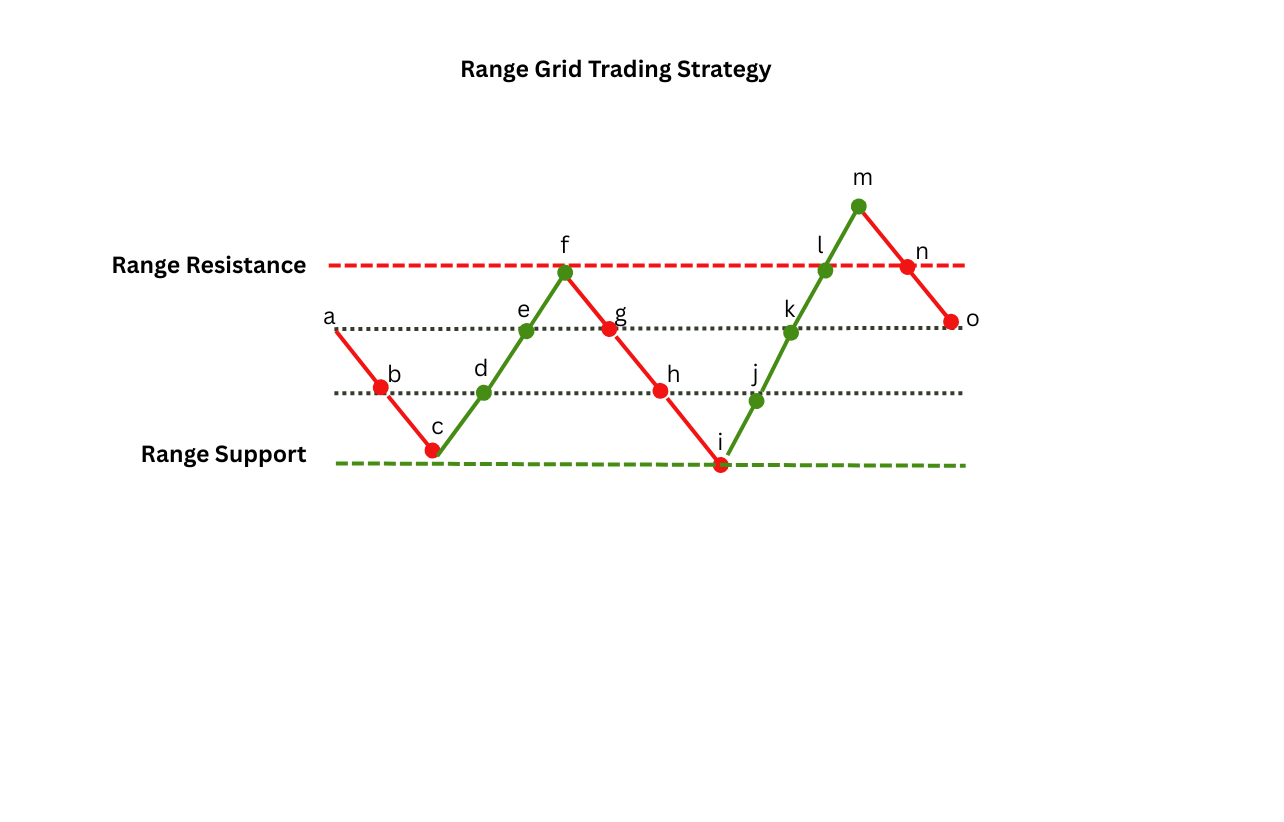
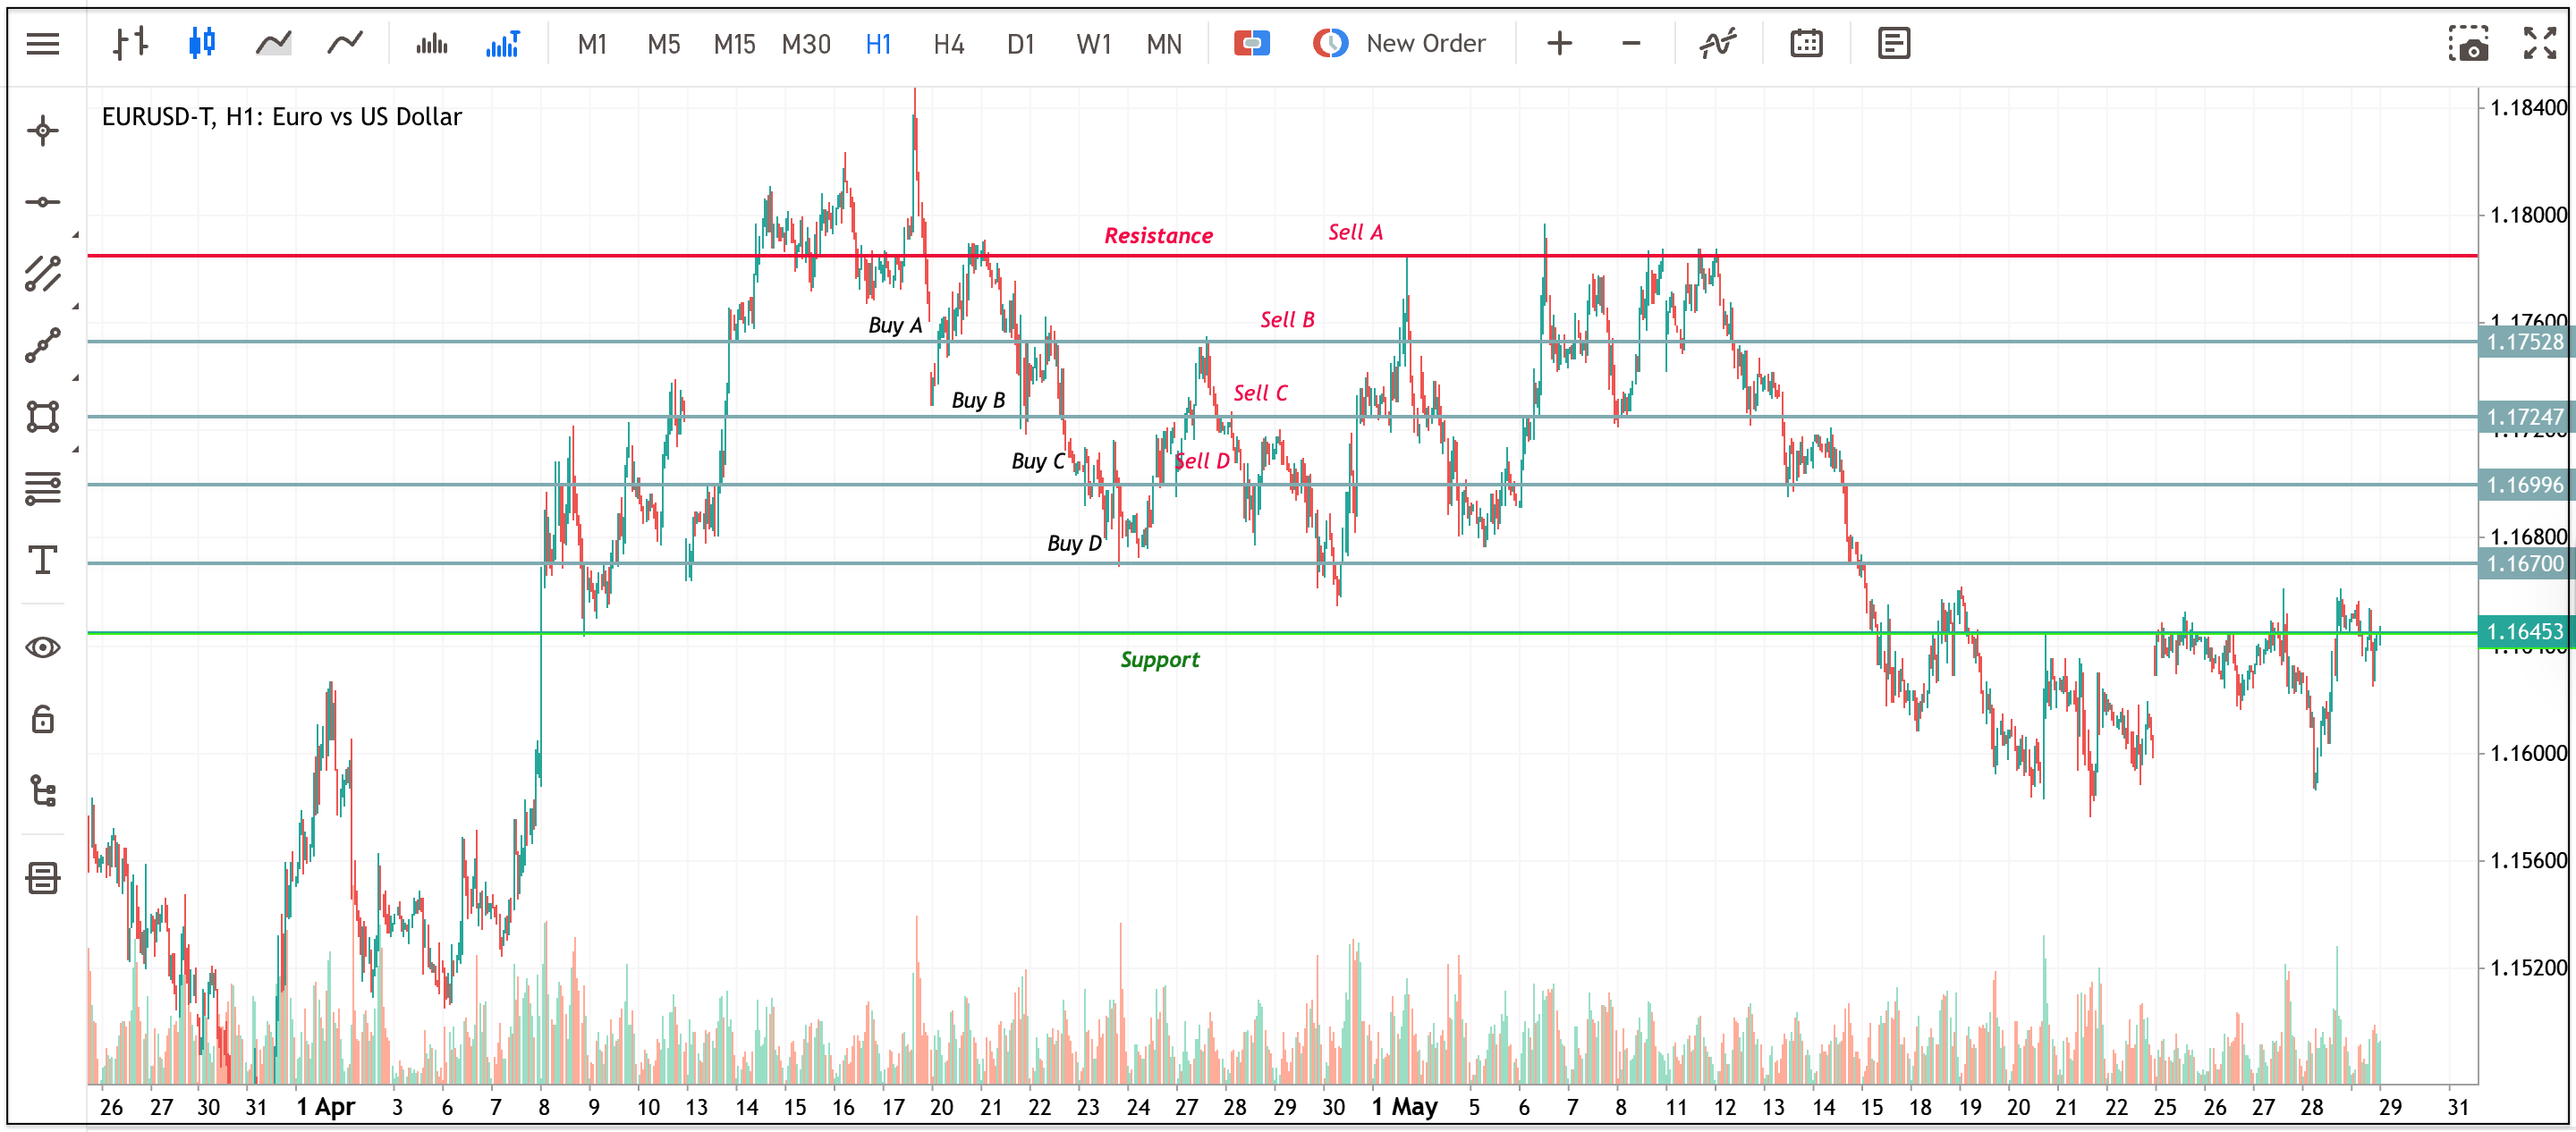
Practical Example of Range Grid on the EURUSD Currency Pair
On a EURUSD H1 chart, price oscillated within a defined range, capped by a resistance zone and supported by a support zone for a sustained period. Buy orders were placed as price declined through the grid toward support; sell orders as it bounced back toward resistance, repeating across multiple oscillations while the range held.
In the example, the structure generated potential gains on completed cycles in both directions, though outcomes per cycle vary with execution and spread. Price eventually broke below support on a sustained move, which would have triggered a pre-set stop below the range and ended the setup.
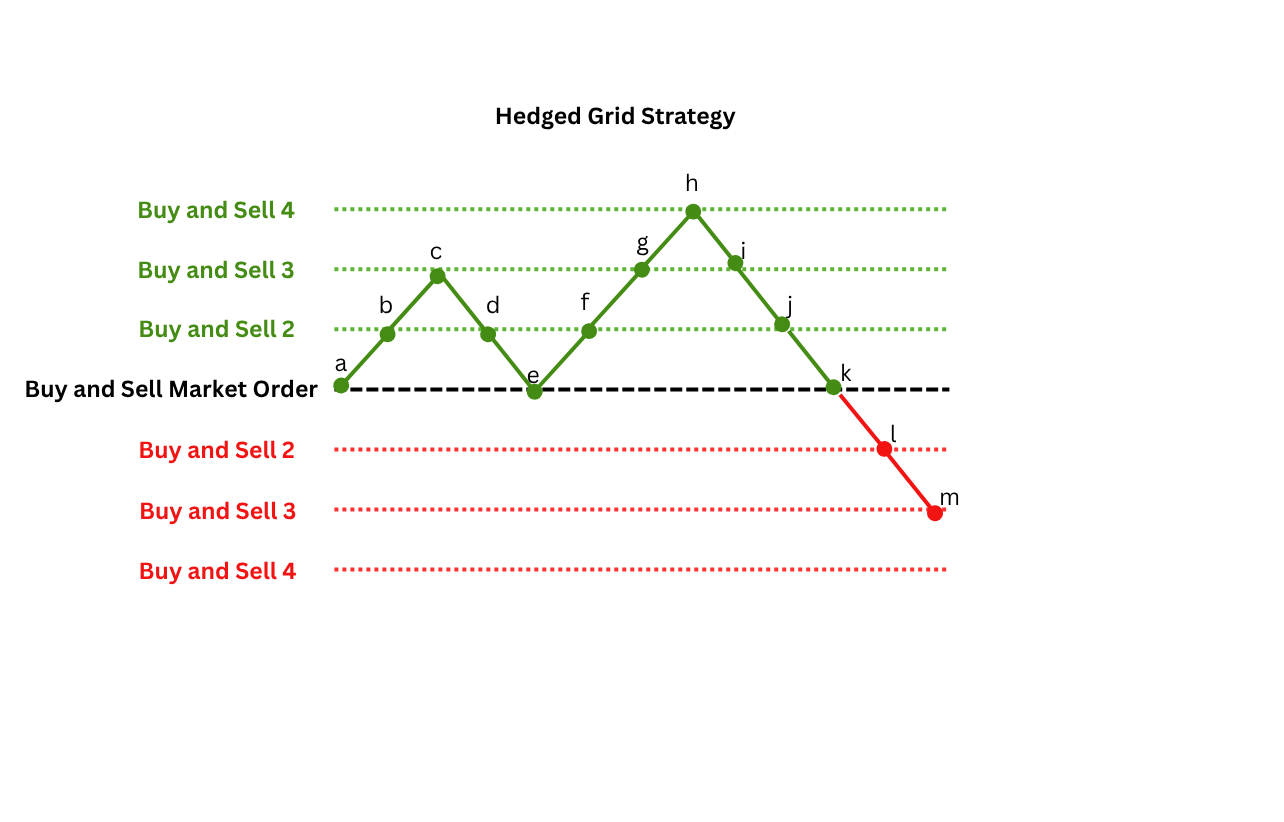
3. Hedged Grid Trading Strategy
The hedged grid, sometimes called a hedging grid trading strategy, is a variation built for range-bound markets, where price moves sideways between support and resistance. Rather than predicting direction, the trader responds to both sides of the move, though success is not guaranteed. Both a buy and a sell order are placed at every grid level, and notably, traditional stop losses are not used here: profitable trades are closed at the next level while losing trades are held until price swings back.
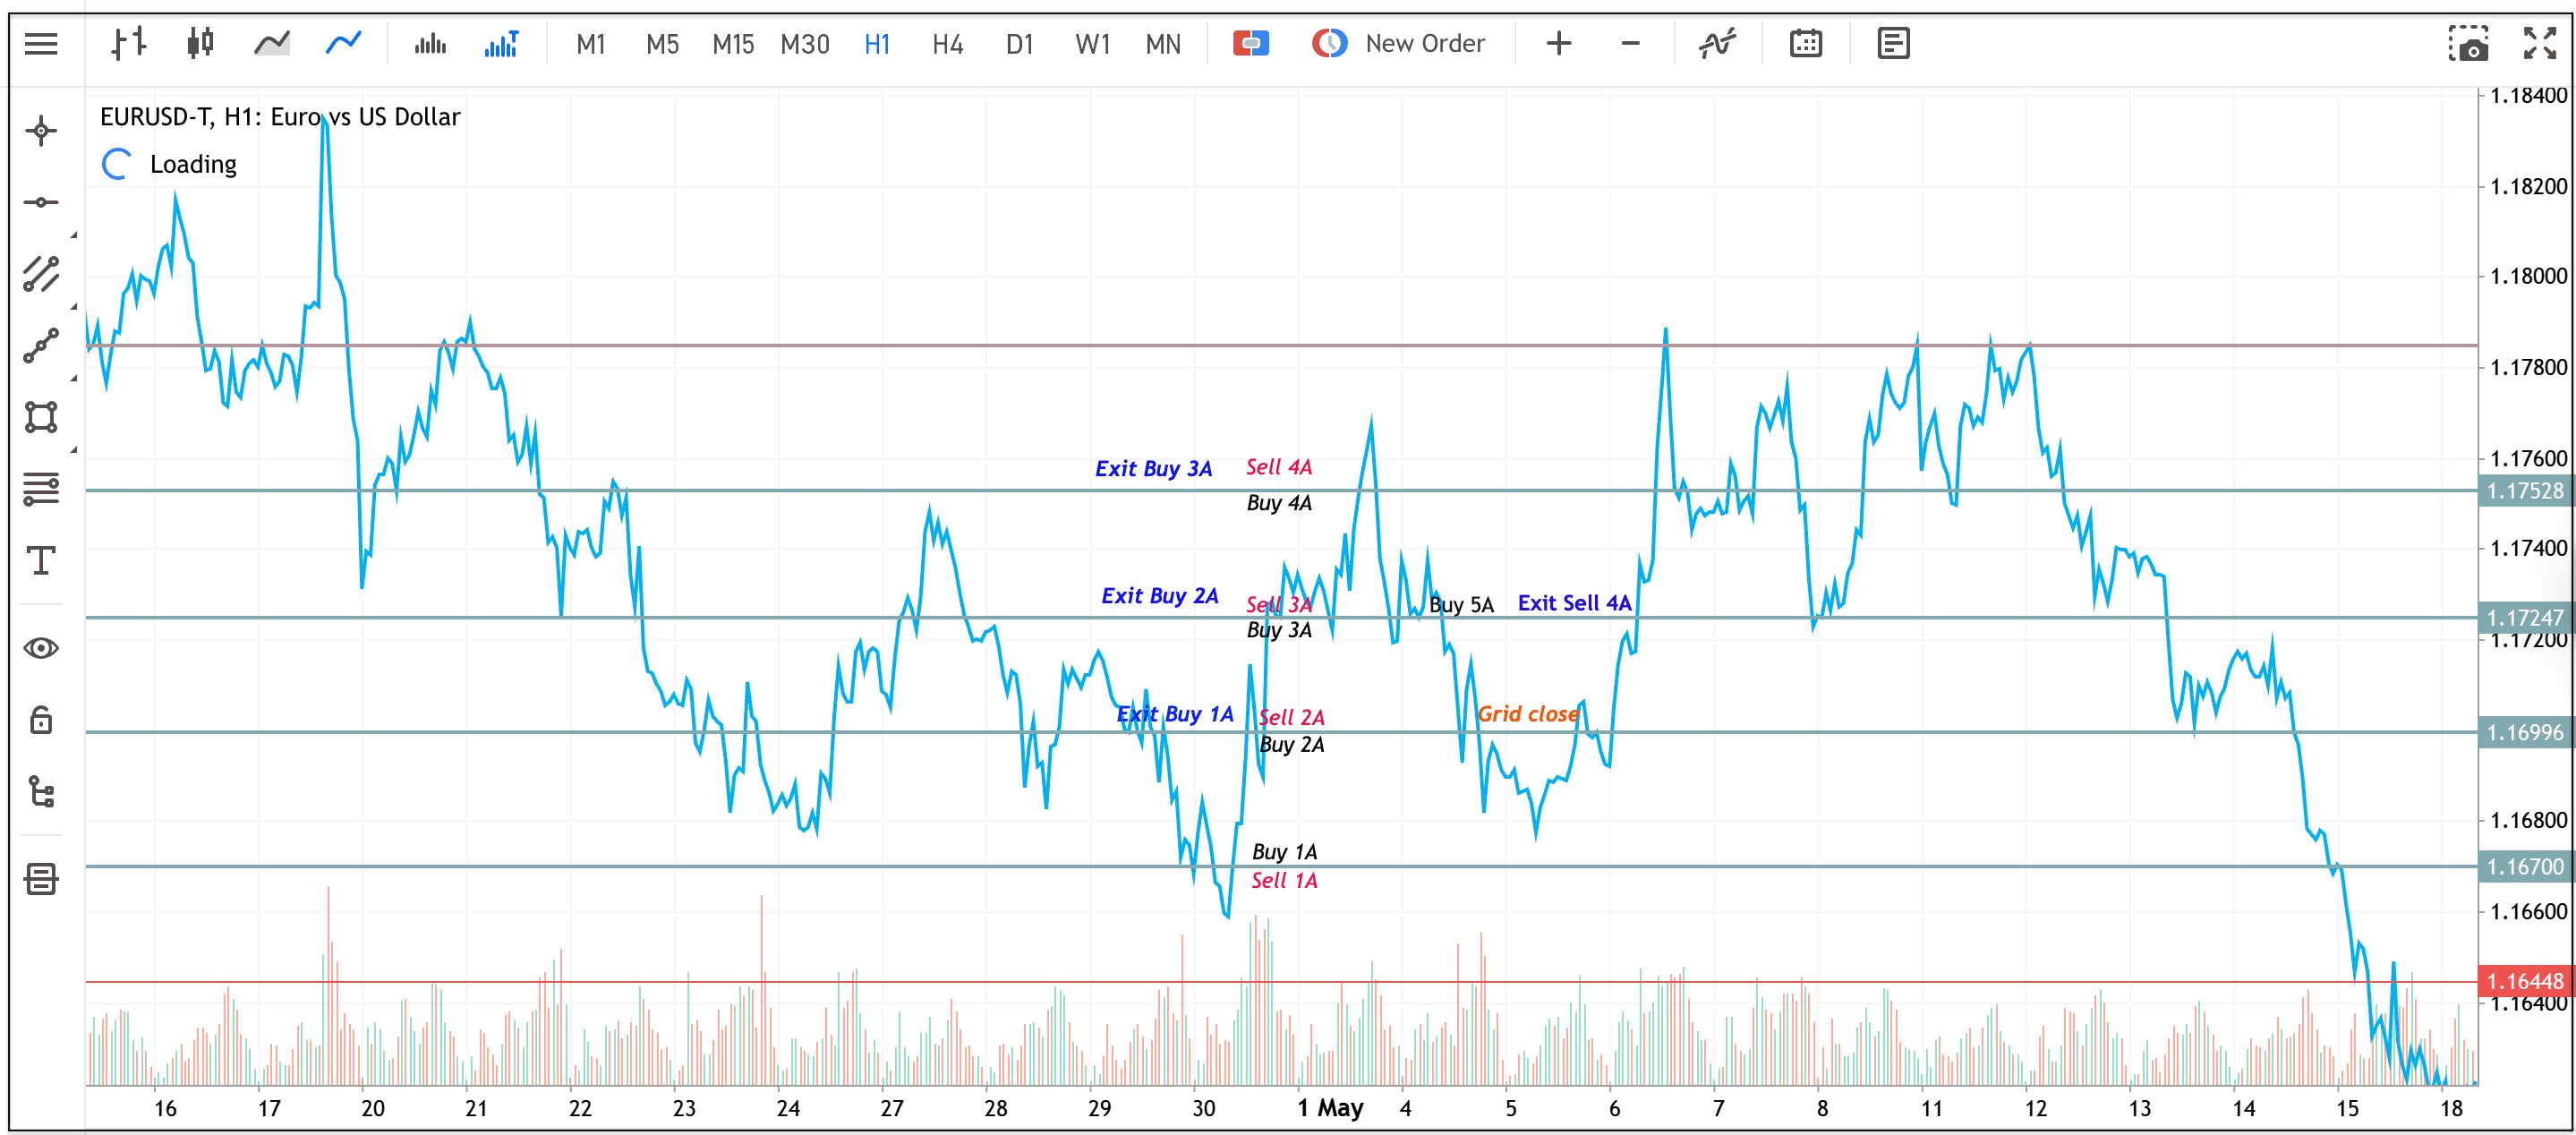
Practical Example of Hedged Grid on EURUSD Currency Pair
Applied to the same EURUSD consolidation range with no stop losses, buy and sell orders were placed at each level as price moved through the range, building exposure on both sides. As price rose, buy positions were closed for potential gains while the matching sells stayed open and carried losses; when price reversed, a sell was closed for a gain before the remaining positions were held through the retracement and closed together at the grid-close point.
Grid Trading Risk Management: What to Consider Before You Start
Before placing the first grid order, four things tend to determine whether the setup holds up in practice:
- Market structure and volatility: Is the market trending, ranging, or highly unpredictable? Each grid type suits a different environment. Setting up the wrong grid in the wrong conditions is often where traders make costly mistakes.
- Market timing: Forex grid trading doesn't require prediction, but major events such as central bank decisions or NFP releases can trigger sharp, one-directional moves that may overwhelm a grid's risk parameters.
- Broker commissions: Spreads, commissions, and overnight swap fees accumulate quickly across multiple open positions. So, it’s good to calculate the break-even pip requirement per level before taking a position.
- Margin management: If trades stack heavily in one direction, margin pressure can build quickly. If account equity falls below the broker’s margin requirements, the broker may automatically liquidate positions at a loss. A meaningful buffer above the minimum margin requirement is generally advisable.
Which Grid Trading Strategy Should You Use?
How to Set Up an Automated Grid Trading Strategy
There are two ways to implement a grid trading strategy: manually, or through an automated system such as an Expert Advisor (EA). Each approach has its tradeoffs, depending on how closely you want to manage the strategy in real time.
1. Manual Grid Trading Strategy
To set up a grid manually on a platform like MetaTrader 5, you first determine your position size and grid gap spacing. This spacing should align with the timeframe you are trading and the instrument's volatility. The more volatile the market, the wider your spacing may need to be, so that price fluctuations do not trigger all orders prematurely.
Many traders use the horizontal line tool to mark equal-interval entry zones, then place pending orders near those levels directly from the chart. Tools like the Average True Range (ATR) may help measure volatility and define realistic pip intervals.
2. Forex Grid Trading EA: Grid Bot Setup & Automation
A grid trading bot, implemented on MetaTrader as a forex grid trading EA, reads price levels and automatically places, manages, and closes orders based on parameters you define in advance. For routine execution, this may remove some emotional bias from order management. How a grid bot behaves in practice depends entirely on the parameters you set:
The main parameters to configure when setting up a forex grid trading EA are:
For traders running a grid bot continuously, a Forex VPS can keep an EA active around the clock without relying on a computer staying on. This may reduce missed grid triggers from downtime or disconnection. *Terms & Conditions apply.
The Bottom Line on Grid Trading
To wrap up, grid trading might seem simple at first glance. But that structure does not make it effortless.
A successful grid trading strategy is generally one built on defined parameters, tested thoroughly before being applied to live markets, and adjusted as conditions evolve. It is not a one-size-fits-all approach. But for traders who prefer logic and structure over speculation, grid trading may be a useful tool, provided you remain adaptable and manage your risk carefully.
If you are building confidence with trading grid and want to test your setup in simulated market conditions before committing live capital, a demo account gives you exactly that.
Click on the banner below to practice your grid trading strategy.
Frequently Asked Questions on Grid Trading
Is grid trading suitable for beginners?
It can be, but only after learning basic risk management and testing the strategy on a demo account.
Can grid trading be automated?
Yes. Grid trading can be automated using trading bots or Expert Advisors (EAs).
What market conditions are suitable for grid trading?
Grid trading is suitable for sideways or range-bound markets where prices bounce between support and resistance levels. However, it can also be applied in trending markets by using a trend-following grid setup.
When should I not use a grid trading strategy?
Avoid grid trading during high-impact news events and strong one-directional market trends that can overwhelm the grid structure.
The given data provides additional information regarding all analysis, estimates, prognosis, forecasts, market reviews, weekly outlooks or other similar assessments or information (hereinafter “Analysis”) published on the websites of Admirals investment firms operating under the Admirals trademark (hereinafter “Admirals”) Before making any investment decisions please pay close attention to the following:
- This is a marketing communication. The content is published for informative purposes only and is in no way to be construed as investment advice or recommendation. It has not been prepared in accordance with legal requirements designed to promote the independence of investment research, and that it is not subject to any prohibition on dealing ahead of the dissemination of investment research.
- Any investment decision is made by each client alone whereas Admirals shall not be responsible for any loss or damage arising from any such decision, whether or not based on the content.
- With view to protecting the interests of our clients and the objectivity of the Analysis, Admirals has established relevant internal procedures for prevention and management of conflicts of interest.
- The Analysis is prepared by an analyst (hereinafter “Author”). The Author Amrita Kundu is a contractor for Admirals. This content is a marketing communication and does not constitute independent financial research.
- Whilst every reasonable effort is taken to ensure that all sources of the content are reliable and that all information is presented, as much as possible, in an understandable, timely, precise and complete manner, Admirals does not guarantee the accuracy or completeness of any information contained within the Analysis.
- Any kind of past or modelled performance of financial instruments indicated within the content should not be construed as an express or implied promise, guarantee or implication by Admirals for any future performance. The value of the financial instrument may both increase and decrease and the preservation of the asset value is not guaranteed.
- Leveraged products (including contracts for difference) are speculative in nature and may result in losses or profit. Before you start trading, please ensure that you fully understand the risks involved.