Trading News for Beginners - What is a Bearish Trend?
This article answers the question that every newcomer to trading news must ask themselves: what are bearish trends and how important are they in trading?
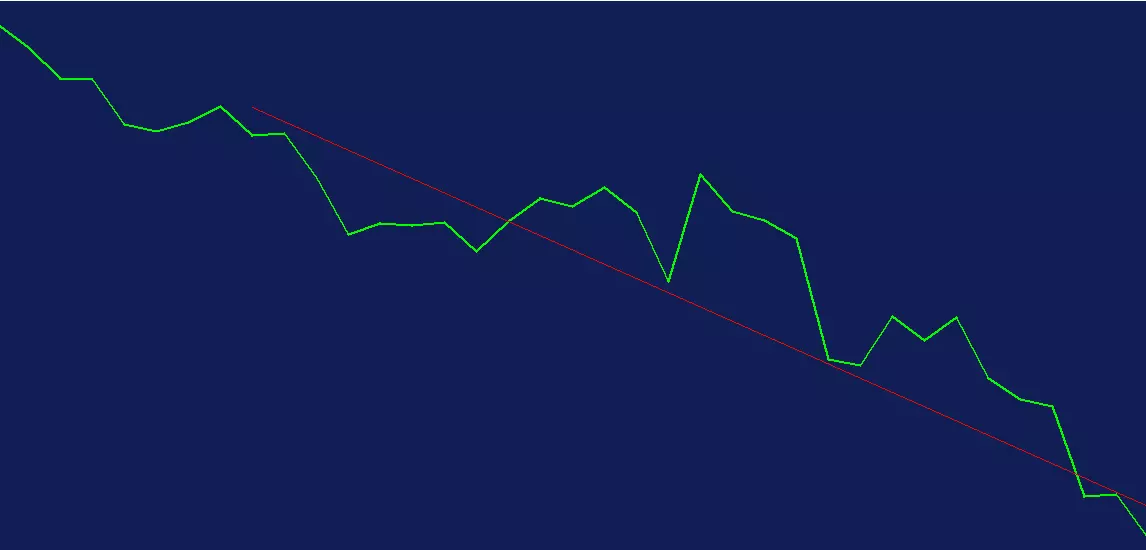
The term ‘bear market’ means a market in which prices are declining. In technical analysis charts, a bearish market trend is represented by a downward sloping trend line.
History of bear market trend
The history of the word ‘bear’ to describe a downtrend is thought to come from the old blood sport of bull-and-bear fights. Another historical reference comes from the publisher of The Tatler, Richard Steele, who described ‘selling a bear’ as putting real value on an imaginary object.
Whatever its origins, the image of a grumpy bear seems to suit the investor sentiment of selling off assets in order to find better returns elsewhere.
Bearish trends appear in all kinds of markets. A bearish stock market means a sell-off on the stock exchange. A bearish trend in a Forex currency or crypto-currency pair reflects a decline in one of the currencies in the pair, meaning a corresponding increase in the strength of the other currency.
Bearish trends are the opposite of bullish trends. Bullish trends imply an upward movement in the prices of stocks, currencies or other assets like commodities.
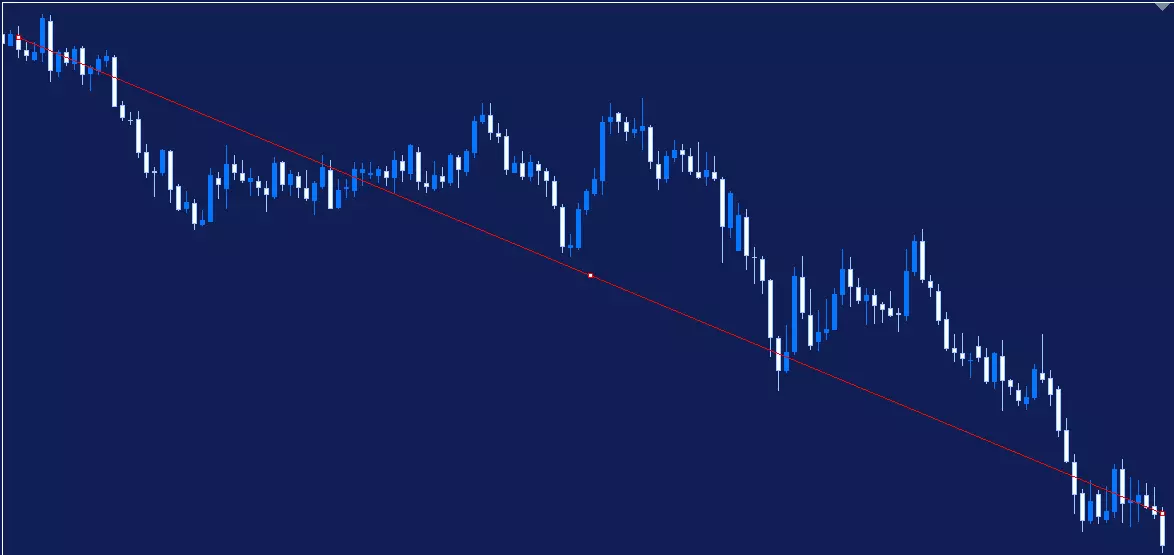
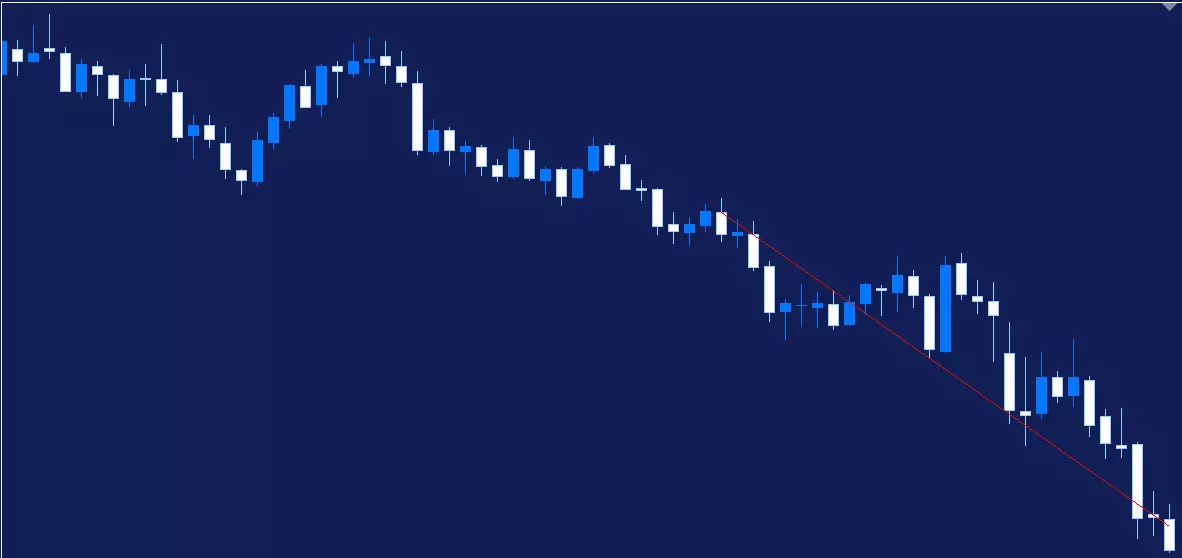
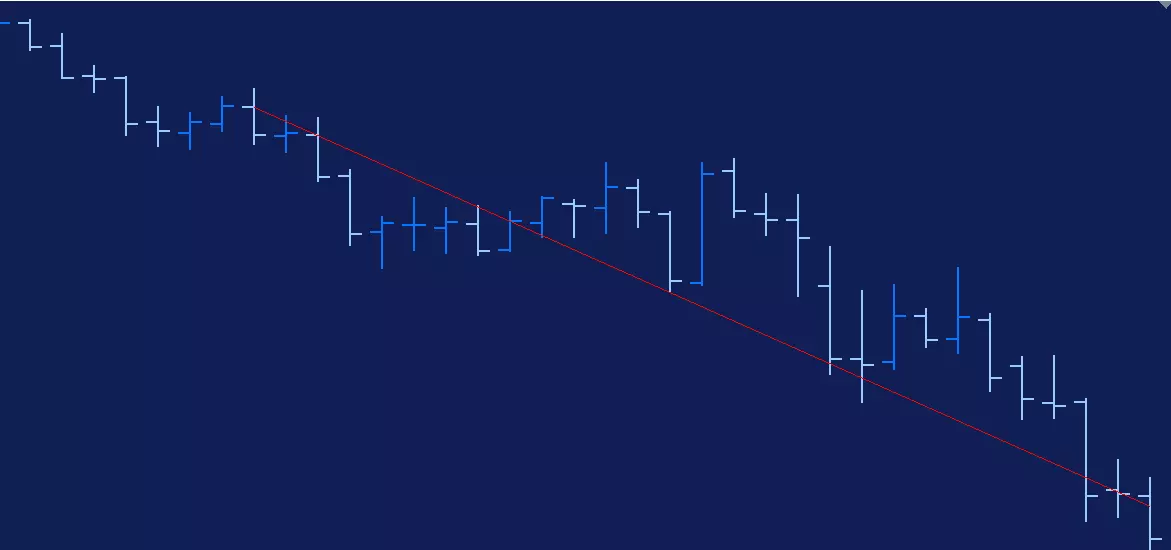
Below you can see some examples of bearish trends using different types of technical analysis charts.
Candlestick Chart
Bar Chart
Line Chart
As you can see, bearish trends are a major theme in trading news and are referred to all the time in the financial media when describing the price movement of an asset and market.
Try and spot bearish trends for yourself by opening an Admirals Demo Account.
Need tutorials and tips on how to trade using MetaTrader 4 or 5? Admirals holds regular trading webinars with experienced hosts. Register today!

This material does not contain and should not be construed as containing investment advice, investment recommendations, an offer of or solicitation for any transactions in financial instruments. Please note that such trading analysis is not a reliable indicator for any current or future performance, as circumstances may change over time. Before making any investment decisions, you should seek advice from independent financial advisors to ensure you understand the risks.