Trading News for Beginners - Big Data in Trading and Investing
APIs, algorithms, software platforms and the mass distribution of trading data and trading news have transformed the way we trade and invest, and the way we consume financial information.
Take news and information, for example. When was the last time you read a print newspaper, held it in your hands and squinted to read the words? Instead, we’re squinting at our mobile phones, catching financial news the minute it’s released. Handy notifications from the financial media ping for our attention by the minute if we enable them, and many of them could influence trading and investing decisions.
This behavioural change is even more marked with the latest generations. Only 5 percent of people born at the end of the 1990’s read print newspapers; the vast majority read the news online.
Big Data
Every day, millions of trades and investments are made on global exchanges and in financial institutions. This information is pooled, then fed into trading platforms like MetaTrader 4 and 5 and Webtrader for financial market modelling.
Big data is stored and transferred in petabytes and zettabytes – a single zettabyte is one trillion bytes. Here are some more big numbers: the Bank for International Settlements (BIS) 2019 survey showed that trading in foreign exchange spot and OTC derivatives markets averaged 6.6 trillion USD per day.
As you can see, this information is too big to make sense to the individual trader, so the software was designed to model financial markets in an understandable way. Traders and investors use technical analysis charts to research and visualise market trends with patterns made up of candlesticks or lines.
Historical Record
As a historical record, technical analysis charts hold enormous information and the charts from some instruments are legendary. Back in January 2015, for example, the EURCHF currency pair had a flash crash after the Swiss National Bank withdrew its peg to the EUR amid the financial and economic crisis at the time.
Known as a Black Swan event, the EUR markets went through considerable adjustments in the short term, and the entire situation can be visualised in the candlestick chart below. Can you spot where the EURCHF dropped?
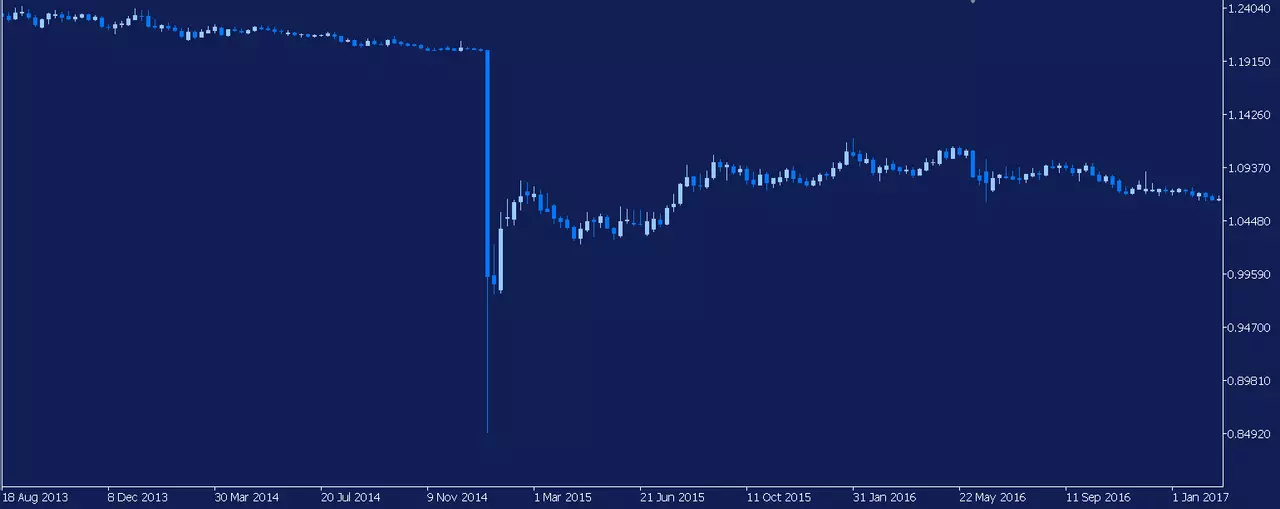
Source: Admirals MetaTrader 5, EURCHF Weekly Chart. Date range: 18 August 2013 – 1 January 2017. Captured 14 July, 2022. Past performance is not a reliable indicator of future results or future performance.
The long cliff-edge blue candlestick shows clearly that the sellers prevailed during this trading event. That one clean and simple line represents the incredible complexity of millions of trades made around the world at the time.
Don’t worry! As a trader and investor, you don’t have to follow the technological tracks of big data because Admirals includes technical analysis tools in the trading platforms accessed from your account. In addition, you can access breaking financial news from Dow Jones in your account, making your account an inclusive informational resource.
Along with the rapid flow of big trading data, technology also exists to assist with risk management, including setting stop losses.
As a beginner, it’s smart to learn your trading and investing skills on our Demo account and follow Admirals free webinars, including Live Trading sessions with expert traders. We offer on-demand learning with the Zero to Hero Forex Course and the learning doesn’t end there. Your financial journey is supported with learning and informational resources from the beginner’s level all the way through to the expert’s level.
This material does not contain and should not be construed as containing investment advice, investment recommendations, an offer of or solicitation for any transactions in financial instruments. Please note that such trading analysis is not a reliable indicator for any current or future performance, as circumstances may change over time. Before making any investment decisions, you should seek advice from independent financial advisors to ensure you understand the risks.

