How to Trade Uber After Fiscal Q2 2025 Performance

Founded in 2009 and headquartered in San Francisco, California, Uber Technologies, Inc. (NYSE: UBER) is one of the world's leading ridesharing and mobility companies. It offers a wide range of services, including Uber Rides, Uber Eats, and Uber Freight. The company connects people to transportation, food delivery, and logistics, but is also expanding its presence in areas like autonomous driving, electric vehicles, and urban air mobility.
Learn more about Uber's fiscal second-quarter 2025 performance and what analysts are forecasting for the stock. This material is for informational purposes only and not financial advice. Consult a financial advisor before making investment decisions.
| Stock: | Uber Technologies Inc. |
| Symbol for Invest.MT5 Account: | UBER |
| Date of Idea: | 11 August 2025 |
| Timeline: | 1 - 12 months |
| Entry Level: | $93.00 |
| Target Level: | $150.00 |
| Position Size for Invest.MT5 Account: | Max 5% |
| Risk: | High |
- The Invest.MT5 account allows you to buy real stocks and shares from some of the largest stock exchanges in the world.
- Risk Warning: Past performance is not a reliable indicator of future results or future performance. All trading is high risk, and you can lose more than you risk on a trade. Never invest more than you can afford to lose as some trades will lose and some trades will win. Start small to understand your own risk tolerance levels or practice on a demo account first to build your knowledge before investing.
- Trading is not suitable for everyone. Trading is highly speculative and carries a significant risk of loss. While it offers potential opportunities, it also involves high volatility, and leveraged trading can amplify both gains and losses. Retail investors should fully understand these risks before trading.

Uber Fiscal Q2 2025 Performance Summary
| Performance Metric | Actual Result | Expected Result | Beat or Miss? |
| Earnings per Share | $0.63 | $0.62 | Beat ✅ |
| Revenue | $12.65 billion | $12.46 billion | Beat ✅ |
Key Takeaways
- Revenue of $12.65 billion up 18% recorded an 18% year-over-year increase
- Net income up 33% to $1.35 billion
- Free cash flow up 44% to $2.5 billion
- Trips grew 18% year-over-year with gross bookings up 17% to $46.8 billion
- New $20 billion share buyback announced
- Uber's freight business remains under pressure with a flat and declining performance
- Some concerns remain regarding Uber's autonomous vehicle (AV) strategy and how it plans to monetise it
Source: Uber Quarterly Results
Uber 12-Month Analyst Stock Price Forecast
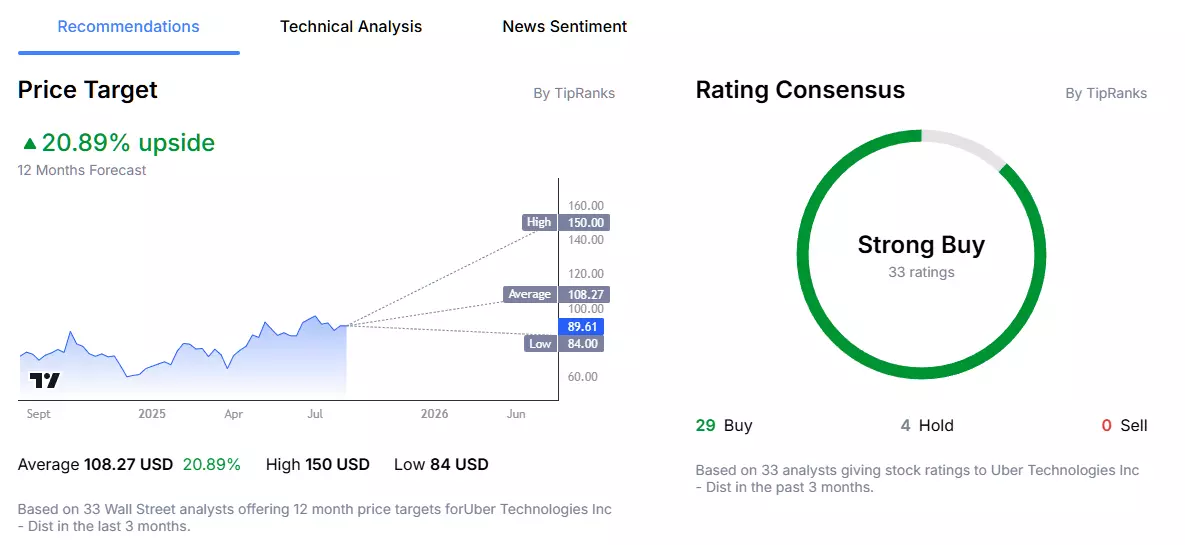
According to 33 Wall Street analysts, polled by TipRanks, offering a 12-month stock price forecast for Uber over the past 3 months:
- Buy Ratings: 29
- Hold Ratings: 4
- Sell Ratings: 0
- Average Price Target: $108.27
- High Price Target: $150.00
- Low Price Target: $84.00
Trading Strategy Example: Uber
The following trading examples are for educational purposes only and do not constitute investment advice. Investors should conduct independent research before making trading decisions. An example trading idea for the Uber share price could be as follows:
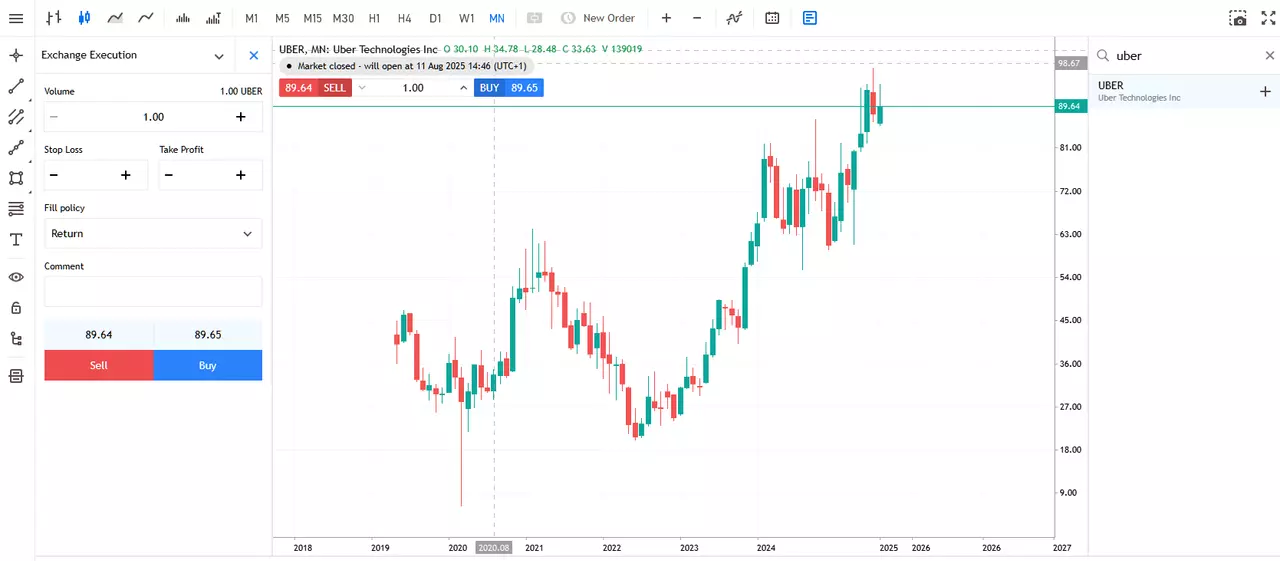
| Entry: | Break above post-earnings high at $93.00 |
| Target: | Just below the highest analyst price target at $150.00 |
| Risk: | Small, maximum 5% of the account |
| Timeline: | 1-12 months |
| TRADE EXAMPLE | |
| Buy 10 Uber Shares: | $930 (10 * $93.00) |
| If Target Reached: | $570 potential profit ($150.00 - $93.00 * 10) |
| If Target Not Reached: | Let's say a trader decided to close the trade below their entry, at the lowest analyst price target of $84.00. This would result in a $90 loss ($93.00 - $84.00 * 10) |
| Invest.MT5 Account Commission: | 10 shares * $0.02 per share for US stocks = $0.20 (Triggers Minimum Transaction Fee of $1.00) |
Remember that markets are volatile, and Uber’s stock price will fluctuate and may even trend lower. While the company posted strong Q2 2025 results, several headwinds remain. These include regulatory uncertainty in key markets, declining growth in the Freight segment, and increased competition in the autonomous vehicle and robotaxi space. In addition, there are ongoing potential litigation and regulatory scrutiny issues over driver classification and labour practices, which could affect the stock price negatively. lead to significant financial liabilities.
How to Buy Uber Stock in 4 Steps
- Open an account with Admirals to access the dashboard.
- Click on Trade or Invest on one of your live or demo accounts to open the web platform.
- Search for your stock in the search window at the top.
- Input your entry, stop-loss and take profit levels in the trading ticket.

Do You See the Uber Stock Price Moving Differently?
If you believe there is a higher chance the share price of Uber will move lower, then you can also trade short using CFDs (Contracts for Difference). However, these have higher associated risks and are not suitable for all investors. Learn more about CFDs in this How to Trade CFDs article.
INFORMATION ABOUT ANALYTICAL MATERIALS:
The given data provides additional information regarding all analysis, estimates, prognosis, forecasts, market reviews, weekly outlooks or other similar assessments or information (hereinafter “Analysis”) published on the websites of Admirals' investment firms operating under the Admirals trademark (hereinafter “Admirals”). Before making any investment decisions, please pay close attention to the following:
1. This is a marketing communication. The content is published for informative purposes only and is in no way to be construed as investment advice or recommendation. It has not been prepared in accordance with legal requirements designed to promote the independence of investment research, and that it is not subject to any prohibition on dealing ahead of the dissemination of investment research.
2. Any investment decision is made by each client alone whereas Admirals shall not be responsible for any loss or damage arising from any such decision, whether or not based on the content.
3. With view to protecting the interests of our clients and the objectivity of the Analysis, Admirals has established relevant internal procedures for prevention and management of conflicts of interest.
4. The Analysis is prepared by an analyst (hereinafter “Author”). The Author, Jitanchandra Solanki, is an employee of Admirals. This content is a marketing communication and does not constitute independent financial research.
5. Whilst every reasonable effort is taken to ensure that all sources of the content are reliable and that all information is presented, as much as possible, in an understandable, timely, precise and complete manner, Admirals does not guarantee the accuracy or completeness of any information contained within the Analysis.
6. Any kind of past or modeled performance of financial instruments indicated within the content should not be construed as an express or implied promise, guarantee or implication by Admirals for any future performance. The value of the financial instrument may both increase and decrease, and the preservation of the asset value is not guaranteed.
7. Leveraged products (including contracts for difference) are speculative in nature and may result in losses or profit. Before you start trading, please ensure that you fully understand the risks involved.