How to Trade Medtronic After Fiscal Q1 2026 Performance
October 13, 2025 16:20

Founded in 1949 and headquartered in Dublin, Ireland, Medtronic plc (NYSE: MDT) is one of the world’s largest medical technology companies. The company’s current focus is to drive growth through new product launches, operational efficiency, and expanding its presence in emerging markets.
Learn more about Medtronic's fiscal first-quarter 2026 performance and what analysts are forecasting for the stock. This material is for informational purposes only and not financial advice. Consult a financial advisor before making investment decisions.
- The Invest.MT5 account allows you to buy real stocks and shares from some of the largest stock exchanges in the world.
- Risk Warning: Past performance is not a reliable indicator of future results or future performance. All trading is high risk, and you can lose more than you risk on a trade. Never invest more than you can afford to lose as some trades will lose and some trades will win. Start small to understand your own risk tolerance levels or practice on a demo account first to build your knowledge before investing.
- Trading is not suitable for everyone. Trading is highly speculative and carries a significant risk of loss. While it offers potential opportunities, it also involves high volatility, and leveraged trading can amplify both gains and losses. Retail investors should fully understand these risks before trading.

Medtronic Fiscal Q1 2026 Performance Summary
Key Takeaways
- Revenue +6% Year-over-Year (YoY); operating margin 18.2% (up from 17.4% a year ago).
- Earnings per share rose to $1.31 (+7% YoY).
- Guidance raised: Full Year 2026 revenue now projected at $33.0 billion - $33.5 billion.
- $500 million in share repurchases during the quarter. Free cash flow of $1.4 billion.
- Cardiovascular segment revenue grew +8% YoY, driven by strong demand for cardiac rhythm and heart failure devices.
- Surgical and neuroscience portfolios delivered mid-single-digit growth, supported by robotics and cranial and spinal technologies.
- Diabetes business revenue increased +10% YoY, led by strong adoption of the MiniMed™ 780G insulin pump system.
- Management emphasised ongoing investments in R&D, next-generation device innovation, and supply-chain optimisation initiatives to improve margins and accelerate product delivery.
- Risks remain around hospital capital spending trends, foreign exchange headwinds, and pricing pressures in certain developed markets.
- Additionally, Medtronic faces competitive challenges in diabetes and cardiovascular devices from newer market entrants and new technologies.
Source: Medtronic Quarterly Results
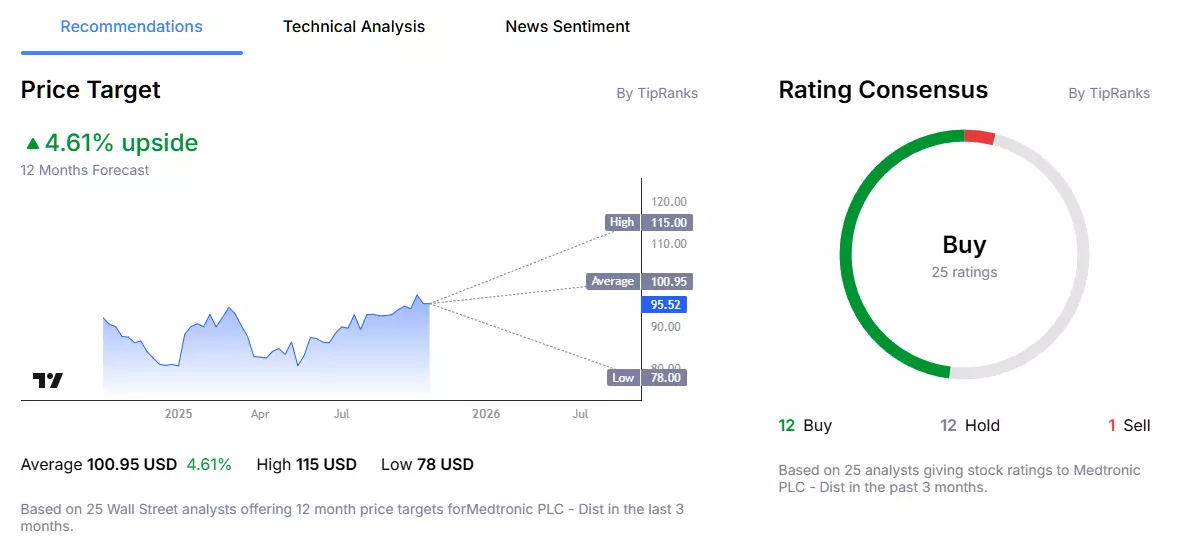
Medtronic 12-Month Analyst Stock Price Forecast
According to 25 Wall Street analysts, polled by TipRanks, offering a 12-month stock price forecast for Medtronic over the past 3 months:
- Buy Ratings: 12
- Hold Ratings: 12
- Sell Ratings: 1
- Average Price Target: $100.95
- High Price Target: $115.00
- Low Price Target: $78.00
Trading Strategy Example: Medtronic
The following trading examples are for educational purposes only and do not constitute investment advice. Investors should conduct independent research before making trading decisions. An example trading idea for the Medtronic share price could be as follows:
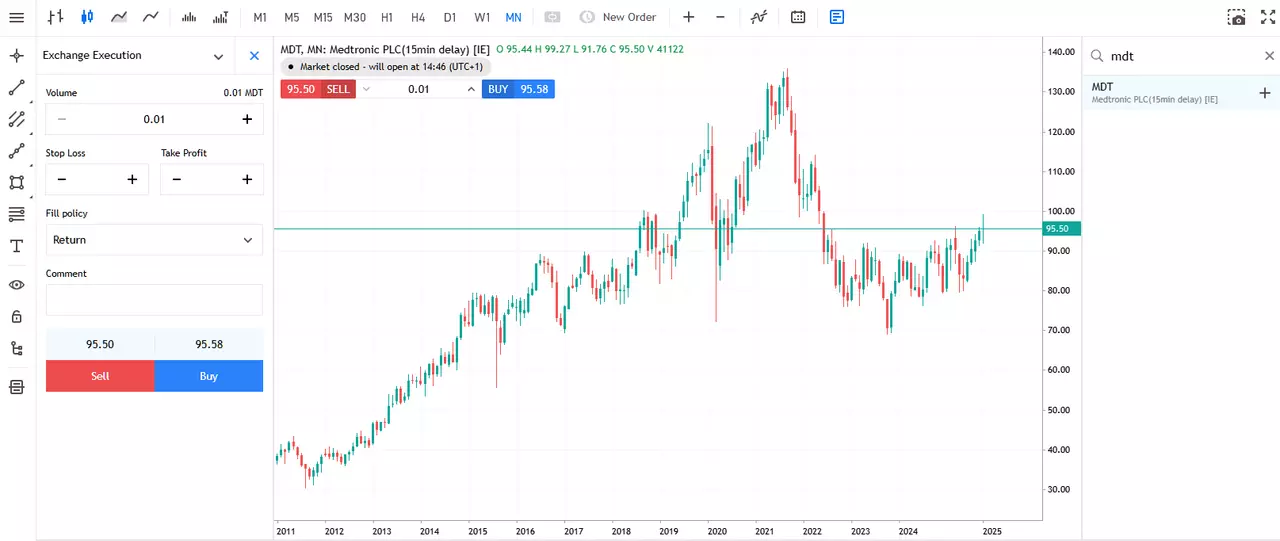
Remember that markets are volatile, and Medtronic’s stock price will fluctuate. Despite its strong earnings and raised guidance, concerns remain regarding regulatory issues, global healthcare spending, and macroeconomic uncertainty. The stock price is currently around 30% below its record high from September 2021.
How to Buy Medtronic Stock in 4 Steps
- Open an account with Admirals by completing the onboarding process.
- Click on Trade or Invest on one of your live or demo accounts to open the web platform.
- Search for your stock in the search window at the top.
- Input your entry, stop-loss and take profit levels in the trading ticket.

Do You See the Medtronic Stock Price Moving Differently?
If you believe there is a higher chance the share price of Medtronic will move lower, then you can also trade short using CFDs (Contracts for Difference). However, these have higher associated risks and are not suitable for all investors. Learn more about CFDs in this How to Trade CFDs article.
The given data provides additional information regarding all analysis, estimates, prognosis, forecasts, market reviews, weekly outlooks or other similar assessments or information (hereinafter “Analysis”) published on the websites of Admirals investment firms operating under the Admirals trademark (hereinafter “Admirals”) Before making any investment decisions please pay close attention to the following:
- This is a marketing communication. The content is published for informative purposes only and is in no way to be construed as investment advice or recommendation. It has not been prepared in accordance with legal requirements designed to promote the independence of investment research, and that it is not subject to any prohibition on dealing ahead of the dissemination of investment research.
- Any investment decision is made by each client alone whereas Admirals shall not be responsible for any loss or damage arising from any such decision, whether or not based on the content.
- With view to protecting the interests of our clients and the objectivity of the Analysis, Admirals has established relevant internal procedures for prevention and management of conflicts of interest.
- The Analysis is prepared by an analyst (hereinafter “Author”). The Author Admirals is an employee /a contractor for Admirals. This content is a marketing communication and does not constitute independent financial research.
- Whilst every reasonable effort is taken to ensure that all sources of the content are reliable and that all information is presented, as much as possible, in an understandable, timely, precise and complete manner, Admirals does not guarantee the accuracy or completeness of any information contained within the Analysis.
- Any kind of past or modelled performance of financial instruments indicated within the content should not be construed as an express or implied promise, guarantee or implication by Admirals for any future performance. The value of the financial instrument may both increase and decrease and the preservation of the asset value is not guaranteed.
- Leveraged products (including contracts for difference) are speculative in nature and may result in losses or profit. Before you start trading, please ensure that you fully understand the risks involved.