While Tesla soars to over $1,000 per share, Facebook reports not entirely positive results
-1.jpg)
Yesterday there were undoubtedly two protagonists that took the attention of the markets for various reasons: Facebook's quarterly results and Tesla's surging share price.
At the beginning of October, Facebook was in the news for the longest ever fall in its services and yesterday, the technological giant presided by Mark Zuckerberg was once again in the spotlight due to the publication of its results. If we look at these results, we can see that despite all the controversies in which it has been involved in recent weeks, Facebook has seen its number of users and profits increase, although its revenue was lower than expected by the market consensus.
Specifically, Facebook obtained Earnings per Share (EPS) of 3.22 dollars and revenues of 29,010 million dollars compared to the 3.19 dollars per share and 29,580 million dollars expected respectively, so revenue was 570 million dollars lower.
These results for the moment are being positively received by investors, as during the pre-opening Facebook shares are trading up close to 2.4% after rising during yesterday's session by 1.26%.
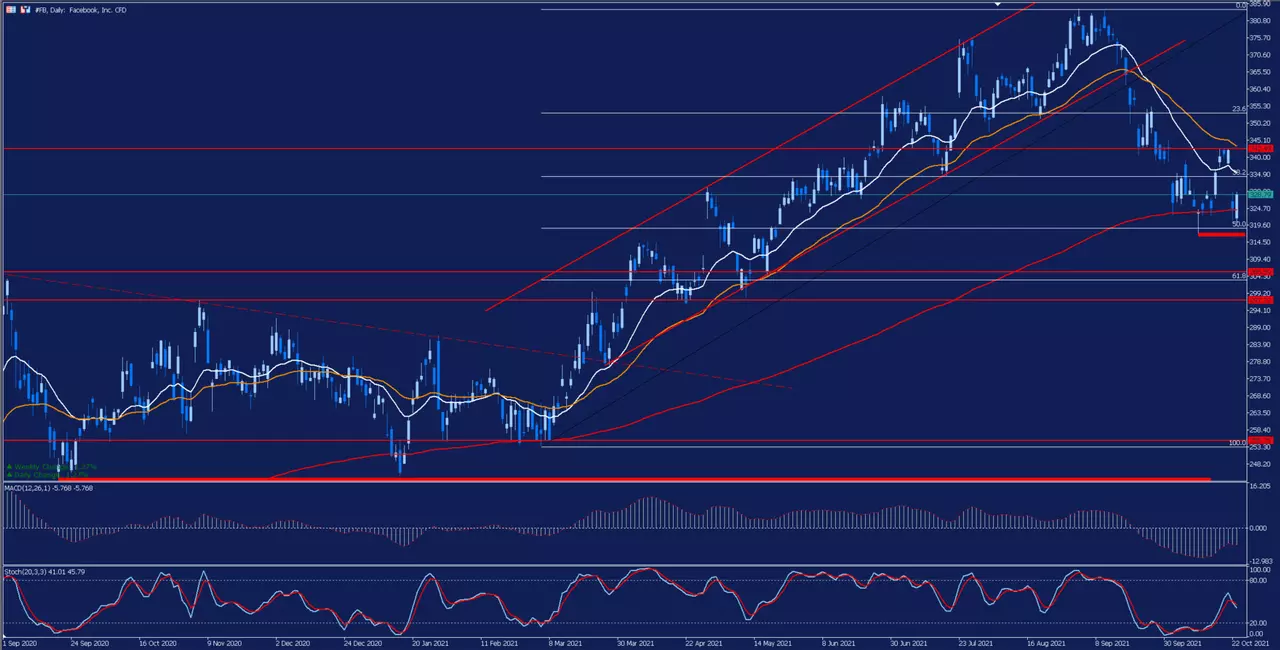
As we can see in the daily chart, after breaking downwards through the important bullish channel that the price has been following most of the year, the price is suffering a strong retracement that has taken it to the 50% Fibonacci retracement level around its 200-session moving average in red, which act as the main support levels. The loss of this support level would open the door to a further price correction in search of $300 per share.
On the contrary, if the price is able to form a floor at this support level, it could be a good starting point for a possible bullish rebound. However, for the moment it must face several resistances and possible legal problems that may arise from its latest controversies.
Evolution of the last five years:
- 2020: 33.09%
- 2019: 56.57%
- 2018: -25.71%
- 2017: 53.38%
- 2016: 9.93%
The second protagonist of yesterday's session was undoubtedly Tesla. The company, chaired by Elon Musk, managed to surpass the psychological level of $1,000 per share, thus joining the select club that includes companies such as Apple, Amazon, Microsoft and Google.
Last week Tesla was in the news for its excellent quarterly results and during yesterday's session their shares soared 12.66% to reach 1,024.86 dollars per share. This rise is thanks to the strong momentum that has been seen over the last weeks in the stock market and their strong sales and orders data. As we have recently learned, the popular car rental company Hertz has announced the purchase of 100,000 Tesla vehicles to renew its rental fleet in an operation that will cost around 4.2 billion dollars.
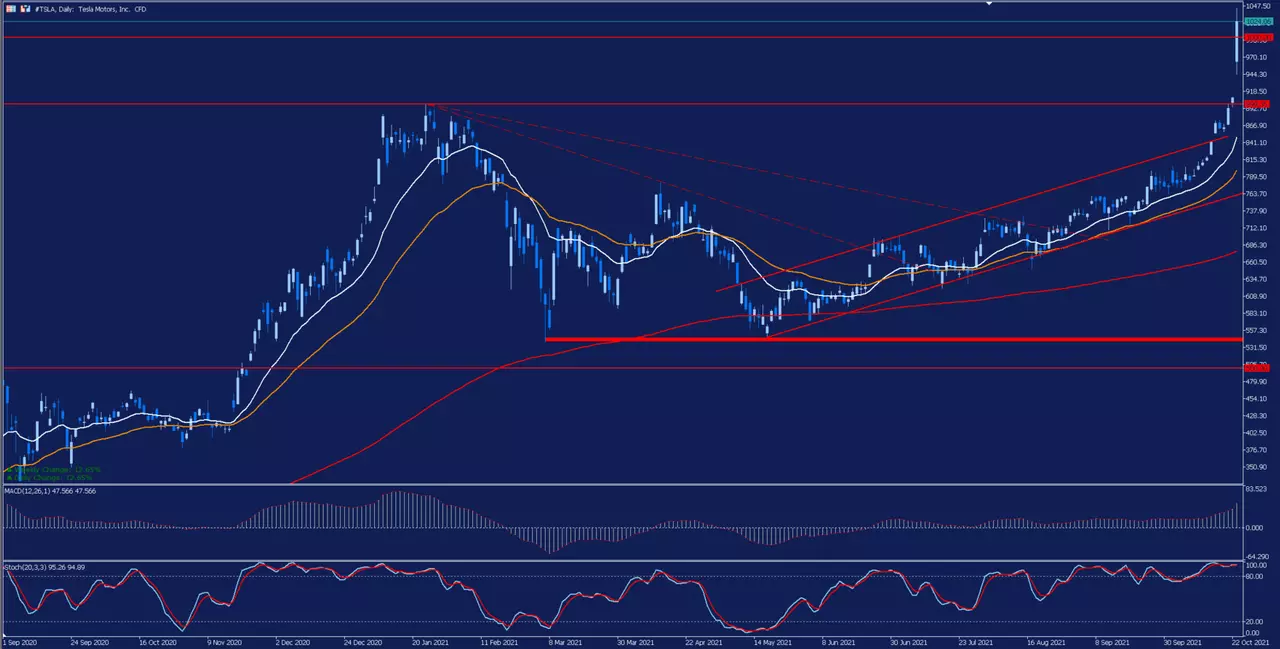
All these factors have caused companies such as Morgan Stanley to increase Tesla's target price to 1,200 dollars per share, so it could still have upside potential. If we look at the daily chart, we can see that, after making a double bottom formation at the lower red band, the price formed an important bullish channel that it had been following for the last few months until it broke above the upper band of this channel on 15 October and began a strong bullish rally.
Since the beginning of September, share price has risen by 39.30%, although the biggest boost has occurred since the break of the bullish channel, as in just 10 days the price has risen by 25.24%.
If we look at its technical indicators, we can see that the uptrend continues to be strong. However, the price is trading far away from its moving averages and its main support levels, so it is possible that we could see some kind of profit-taking retracement to continue its uptrend. As long as the price does not lose the level of 900 dollars per share, the general sentiment will continue to be bullish.
Evolution of the last five years:
- 2020: 743.40%
- 2019: 25.71%
- 2018: 6.89%
- 2017: 45.69%
- 2016: -10.96%
With the Trade.MT5 account from Admirals, you can trade Contracts for Difference (CFDs) on Facebook, Tesla and over 3,000 other shares! CFDs allow traders to attempt to profit from both rising and falling prices, whilst also benefiting from the use of leverage. Click the banner below in order to register for an account today:

INFORMATION ABOUT ANALYTICAL MATERIALS:
The given data provides additional information regarding all analysis, estimates, prognosis, forecasts, market reviews, weekly outlooks or other similar assessments or information (hereinafter “Analysis”) published on the websites of Admirals investment firms operating under the Admirals trademark (hereinafter “Admirals”) Before making any investment decisions please pay close attention to the following:
- This is a marketing communication. The content is published for informative purposes only and is in no way to be construed as investment advice or recommendation. It has not been prepared in accordance with legal requirements designed to promote the independence of investment research, and that it is not subject to any prohibition on dealing ahead of the dissemination of investment research.
- Any investment decision is made by each client alone whereas Admirals shall not be responsible for any loss or damage arising from any such decision, whether or not based on the content.
- With view to protecting the interests of our clients and the objectivity of the Analysis, Admirals has established relevant internal procedures for prevention and management of conflicts of interest.
- The Analysis is prepared by an independent analyst Roberto Rivero, Freelance Contributor (hereinafter "Author") based on personal estimations.
- Whilst every reasonable effort is taken to ensure that all sources of the content are reliable and that all information is presented, as much as possible, in an understandable, timely, precise and complete manner, Admirals does not guarantee the accuracy or completeness of any information contained within the Analysis.
- Any kind of past or modelled performance of financial instruments indicated within the content should not be construed as an express or implied promise, guarantee or implication by Admirals for any future performance. The value of the financial instrument may both increase and decrease and the preservation of the asset value is not guaranteed.
- Leveraged products (including contracts for difference) are speculative in nature and may result in losses or profit. Before you start trading, please ensure that you fully understand the risks involved.