Mixed results in manufacturing PMI data
-min.jpg)
As with the start of every month, during yesterday and today's session we have seen the release of various macroeconomic data, chief among which is the manufacturing PMI data
Yesterday afternoon, the manufacturing PMI data for the US and the UK was released and today was the turn of Spain, Italy, France, Germany and the Euro zone as a whole. The results were quite varied.
On the one hand, we have those which were better than expected, such as the UK, Italy and France. On the other hand, are those which have had a worse than expected result, such as Spain, Germany and the Euro zone as a whole.
The US demonstrated a mixed performance. If we look at the Markit manufacturing PMI versus the US ISM manufacturing PMI, we can see that the former was worse than expected, whereas the latter has exceeded market expectations. We will take this second figure as the more relevant of the two.
The German manufacturing PMI has been worse than expected for the third consecutive month, despite the fact that the preliminary figure published on October 22nd showed a slight improvement. So once again, we can observe the deterioration suffered by the German economy, which is, in turn, dragging down the Euro zone as a whole.
Despite the disappointing macro data, the DAX40 is continuing its positive trend of the last few weeks, bouncing off its important support level whilst volatility has been easing (shown in the ATR indicator).
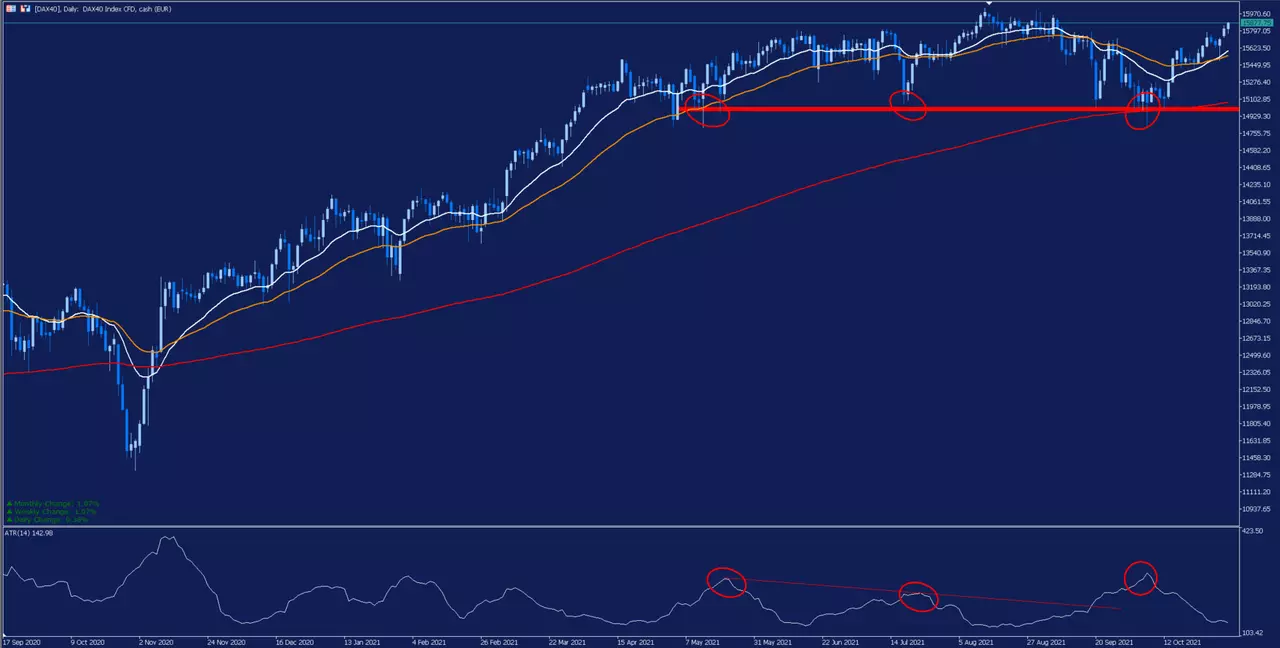
This rebound is leading the German benchmark to surpass the important level of 15,810 points in the area of the highs of June and July. This breakout could lead the price to seek its historical highs in the area of resistance represented by the green band, despite the accumulated overbought levels that we can see in its stochastic indicator.
It is important to follow the evolution of the price over the next few sessions. If it is able to sustain the current rebound, it could face its all-time highs later in the week. A break of this level could open the door to a strong bullish move.
However, if the price makes a rebound, we may see a correction in search of its first support levels. Although, as long as the price remains above the important support/resistance zone represented by the orange band the sentiment should remain positive.
-min.png)
Evolution of the last five years:
- 2020: 3.6%
- 2019: 25.48%
- 2018: -18.26%
- 2017: 12.51%
- 2016: 6.87%
With the Trade.MT5 account, you can trade Contracts for Difference (CFDs) on the DAX40, IBEX35, SP500 and many other instruments. CFDs allow traders to attempt to profit from both rising and falling prices, whilst also benefiting from the use of leverage. Click the banner below to open an account today:

INFORMATION ABOUT ANALYTICAL MATERIALS:
The given data provides additional information regarding all analysis, estimates, prognosis, forecasts, market reviews, weekly outlooks or other similar assessments or information (hereinafter “Analysis”) published on the websites of Admirals investment firms operating under the Admirals trademark (hereinafter “Admirals”) Before making any investment decisions please pay close attention to the following:
- This is a marketing communication. The content is published for informative purposes only and is in no way to be construed as investment advice or recommendation. It has not been prepared in accordance with legal requirements designed to promote the independence of investment research, and that it is not subject to any prohibition on dealing ahead of the dissemination of investment research.
- Any investment decision is made by each client alone whereas Admirals shall not be responsible for any loss or damage arising from any such decision, whether or not based on the content.
- With view to protecting the interests of our clients and the objectivity of the Analysis, Admirals has established relevant internal procedures for prevention and management of conflicts of interest.
- The Analysis is prepared by an independent analyst Roberto Rojas, Freelance Contributor (hereinafter "Author") based on personal estimations.
- Whilst every reasonable effort is taken to ensure that all sources of the content are reliable and that all information is presented, as much as possible, in an understandable, timely, precise and complete manner, Admirals does not guarantee the accuracy or completeness of any information contained within the Analysis.
- Any kind of past or modelled performance of financial instruments indicated within the content should not be construed as an express or implied promise, guarantee or implication by Admirals for any future performance. The value of the financial instrument may both increase and decrease and the preservation of the asset value is not guaranteed.
- Leveraged products (including contracts for difference) are speculative in nature and may result in losses or profit. Before you start trading, please ensure that you fully understand the risks involved.

