Camarilla Template Explained: Analysis in 2018
We still have 2 months of 2017 to enjoy trading both Forex and CFD markets. We've had a lot of success in 2017 regarding our live trading webinars and analyses. 2018 should bring us new trading possibilities on Forex, CFDs, Equities, and Cryptocurrencies. So for all of you who are interested to know more about the template that I use to analyse the price and always give you the best possible setups, here is what you should know….
NB: You can always be the first one to read my analyses in the Technical Analysis section of the Admiral Markets website.
Camarilla Levels
There are numerous types of pivot point indicators available in the world of trading, such as standard ones, Fibonacci, and Murrey Math. For me, there is only one indicator that counts: Camarilla. I have been a big fan of the Camarilla Pivot Point indicator, for good reasons which we will explain in detail below. I consider the Camarilla indicator as the best indicator on the planet for the following reasons:
- It identifies support and resistance;
- It helps with determining the trend;
- It adds confluence to our charts;
- It shows bullish and bearish zones of day and week;
- It spots triggers;
- It provides clear entry and exit points.
When you take a look at the template that I use you will see even more key benefits to you as a trader:
- Levels are generated automatically each trading day;
- It fully supports pre fact analyses, which I make for you each day;
- It is clear and concise;
- The chart stays simple with Camarilla lines.
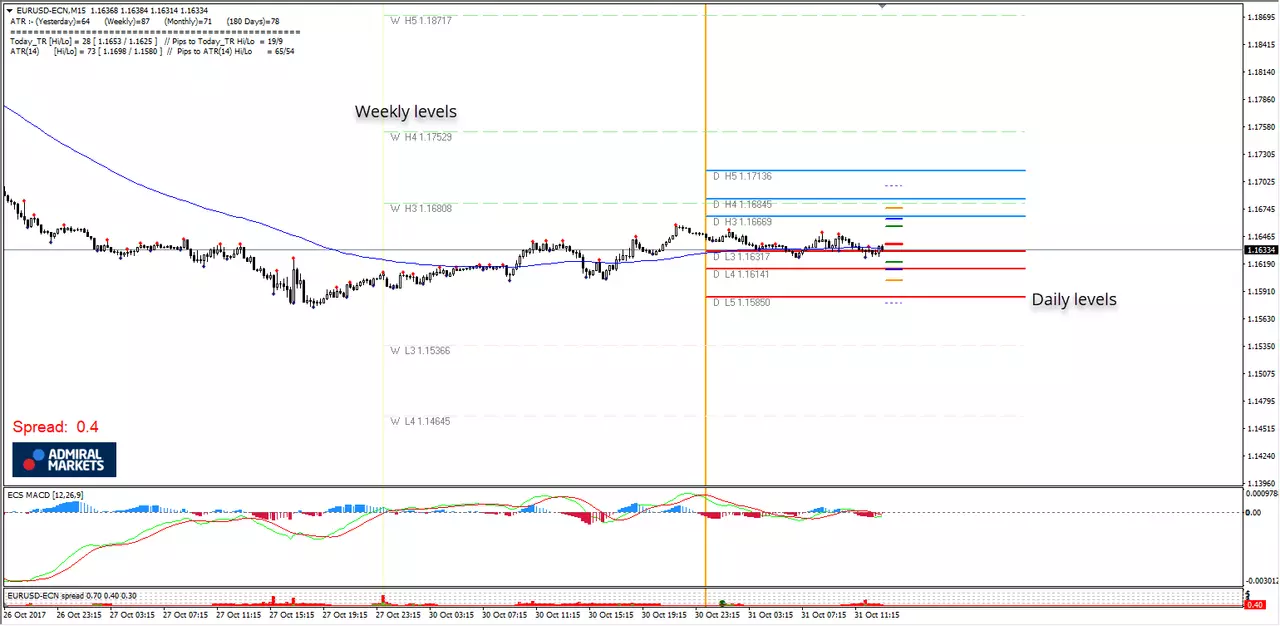
Source: EUR/USD, m15 chart, Admiral Markets platform, Oct 31 2017
Simply put, the Camarilla indicator provides well respected, simple, and automated levels of support and resistance. When I started trading, a friend of mine once told me that Camarilla is also used by some bank and institutional traders. We can easily identify levels of support and resistance and here's how:
- W L3 - Weekly Camarilla Pivot (Weekly Interim Support)
- W H3 - Weekly Camarilla Pivot (Weekly Interim Resistance)
- W H4 - Weekly Camarilla Pivot (Strong Weekly Resistance)
- D H4 - Daily Camarilla Pivot (Very Strong Daily Resistance)
- D L3 – Daily Camarilla Pivot (Daily Support)
-
D L4 – Daily H4 Camarilla (Very Strong Daily Support)
Occasionally you might see D L1, D Cm, and D H1. Those are the very first levels of support and resistance, D Cm being the pivot point for the day.
The H3 and L3 are range levels. Price is in range or consolidation when it's in between the H3 and L3 levels. Traders can use these levels as a break or bounce level. I always try to look at the higher time frame then look for a breakout if a trend is visible on a higher timeframe. I am looking for a bounce if a range is visible on a higher timeframe. The H4 and L4 are the first breakout targets. Price is in a breakout when price manages to break below the L3 or above the H3.
The first initial target is the L4 and H4. Traders can either take profit there or wait for the higher target at H5 and L5. The H5 and L5 are the second breakout targets meaning that the second and the last target for a breakout is the L5 and H5 .Traders who missed the first breakout can attempt to join the breakout after price hits the H4 or L4 upon a pullback or second breakout.
Camarilla levels are the primary source of the confluence that I am looking for when analysing and trading.
ATR Pivots
In this article, you can read about the default ATR indicator. However, I use the modified indicator that shows full ATR price projection. Dotted lines are price projections while coloured lines are ATR pivots. The ATR is always set at 14, representing the previous 14 days of price action.
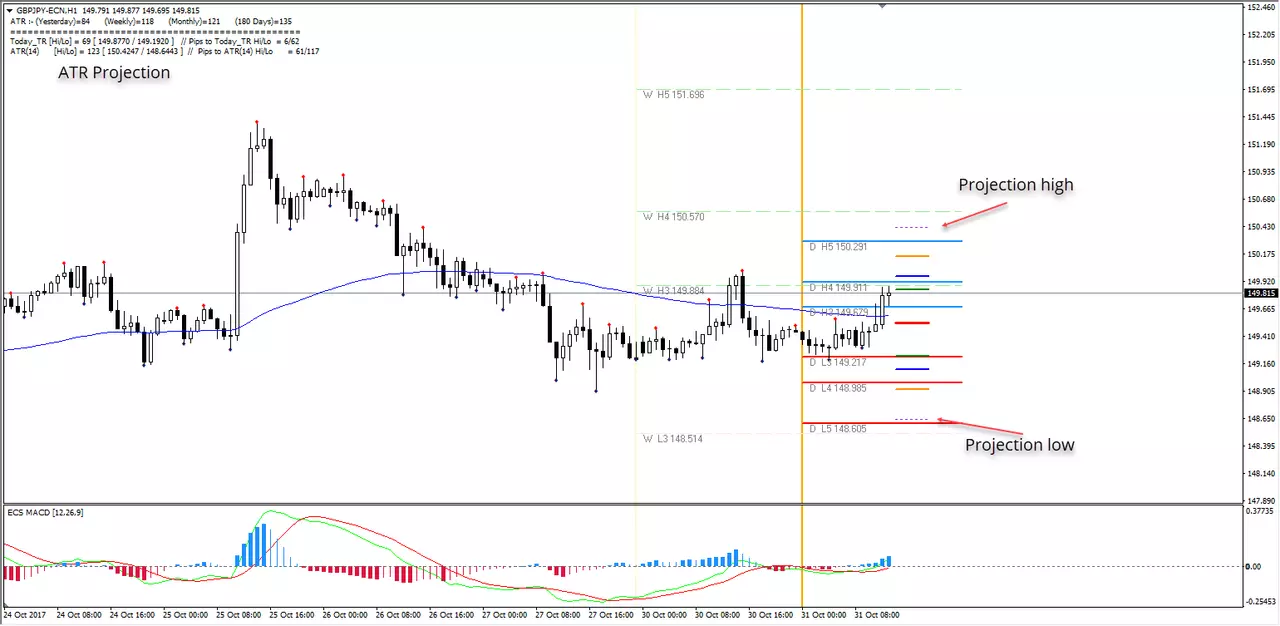
Source: GBP/JPY, H1 chart, Admiral Markets, Oct 2017
ATR projections are important as the secondary part of the confluence and they are usually very well respected, especially when they align with Camarilla pivots.
Fibonacci projections
Fibonacci are the third tool for spotting the confluence. When I see that the price respects a fibonacci level, I know that odds are stacked in my favour.
- 23.6 - Shallow retracement. The price usually bounce off from 23.6 in very strong trends
- 38.2 50.0 61.8 - Main Fib levels. Price will mostly react at these levels.
- 78.6 88.6 - Deeper retracement. These are very strong fib levels and price tend to react the most at these levels.
The 88.6% is my favourite fib retracement. The level is derived by taking The Golden Ratio, 0.618, square rooting it and square rooting it again to get 0.886. Add it to your chart and see it in action.
EMA89
EMA 89 is a strong EMA acting as s/r level, especially designed to fit my own developed T-89 pattern. EMA 89 is a form of 88.6 fib number, so it is not just a coincidence to find it on my chart. The tool is primarily used for analytical purposes or trading the T-89 pattern itself.
MACD
The MACD is one of my favourite indicators for trading. MACD patterns are very common in Forex and CFD trading, which is why I tend to use them in my trading and analysis. Additionally, the MACD is a great tool for spotting trend, momentum and divergence. The MACD is very important in my trading and analyses.
Candlesticks
Candlestick formations are another part of the confluence. For the analysis that I provide you with, not all candlesticks bear the same significance. Pin Bars, Hammers and Marubozu are the most important ones and you can find a deeper analysis of candlestick patterns in the video below.
Order Blocks
By definition, the bullish order block is the height of the bearish candle prior to moving up. Conversely, a bearish order block is the low of a bullish candle prior to moving down. I personally extended the definition by classifying order blocks by their bullish or bearish wicks. Order blocks are also a very important part of the confluence. On my charts they are represented by red/blue dots. I mark it manually because not every order block has the same strength.
Historical Buyers and Sellers
Historical buyers and sellers are always a part of my analysis and template. The biggest advantage of the Forex market compared to other markets is that price repeats itself. The Historical vs. Now moment perspective is something that many analysts and traders don't know of, but in my analyses it is extremely important. When historical buyers or sellers are aligned with the now moment, it stacks even more odds in our favour and the price is likely to reject from that spot.
POC Zones
Now, to sum it all up. All important aspects of price confluence can be found here. The POC zone. POC stands for the Point Of Confluence. This is the zone where I expect price to react. Simply put, when price enters the zone we pull the trigger. Going long or short. Simple as that. So whenever you see the "POC" on my charts, you will know that it is the zone for placing either a short or long.
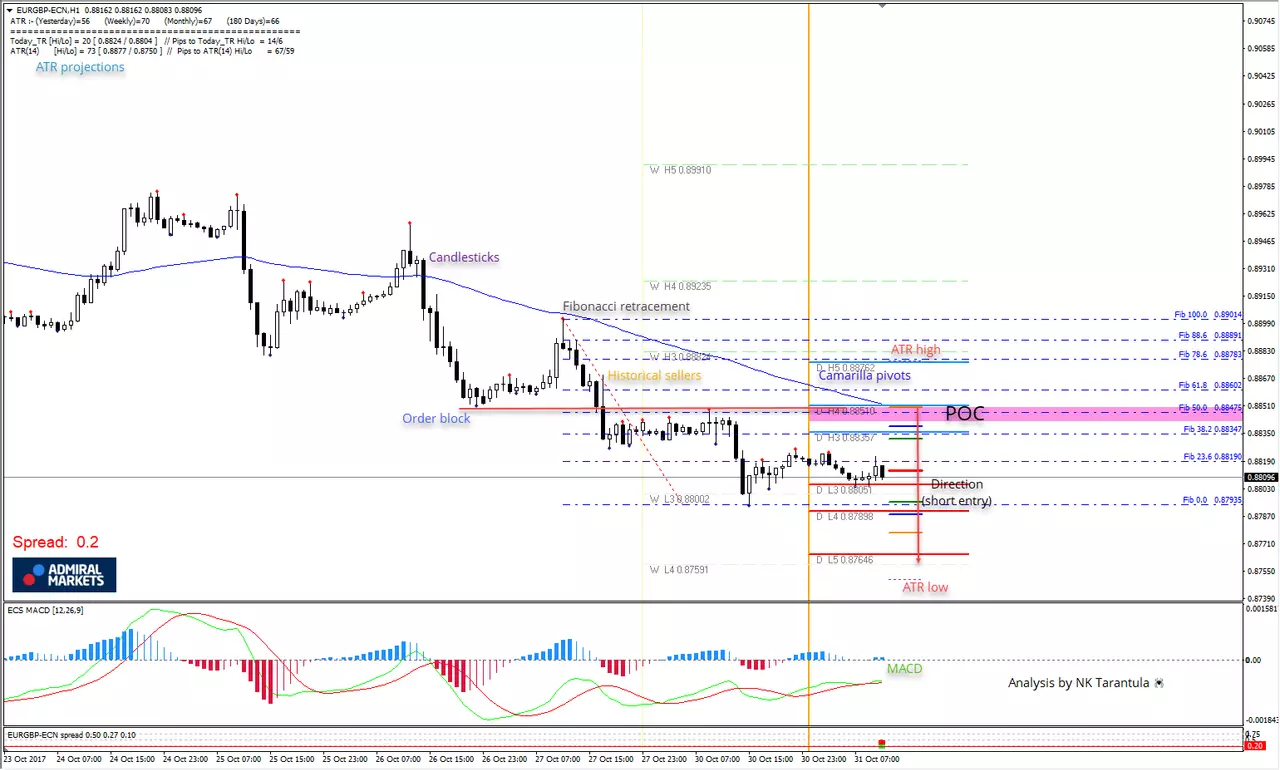
Source: Nenad Kerkez's Camarilla template - example on EUR/GBP H1 chart
So traders, 2018 should be another great year for our live trading webinars and analyses. The best thing is that I am not just an analyst but I'm also a professional trader and, along with my favourite broker – Admiral Markets – I want you to succeed in Forex and CFD trading. The learning curve is steep, but it's well worth it, if you are persistent enough.
Trade With Admiral Markets
If you're feeling inspired to start trading, or this article has provided some extra insight to your existing trading knowledge, you may be pleased to know that Admiral Markets provides the ability to trade with Forex and CFDs on up to 80+ currencies, with the latest market updates and technical analysis provided for FREE! Click the banner below to open your live account today!