Oil CFDs: A Guide to Trading the Crude Oil Market
In early March 2026, crude oil prices moved sharply in response to rising geopolitical tensions. Within a matter of days, prices briefly climbed above $110 per barrel from around $85 per barrel as the U.S.-Iran conflict raised fears of supply disruptions.
Much of the concern centered on the Strait of Hormuz, a narrow yet critical waterway through which roughly one-fifth of the world’s oil supply passes. When uncertainty surrounds a route that important, markets tend to react quickly.
For traders, developments like these are more than geopolitical headlines. They often bring heightened volatility, and with it, potential trading opportunities.
This is one reason many market participants look at oil CFDs. Rather than trading physical oil, CFDs allow traders to take positions on crude price movements without owning the underlying commodity.
Of course, trading crude oil CFDs isn’t as straightforward. It often helps to understand how does oil CFD trading work, what drives oil prices, and the different approaches traders may use before taking their first trade, and that’s what we will break down today, in this article.
Let’s begin.
The information in this article is provided for educational purposes only and does not constitute financial advice. Consult a financial advisor before making investment decisions.
Table of Contents
What is a Crude Oil CFD?
A crude oil Contract for Difference (CFD) is a type of financial derivative that allows traders to speculate on the price movements of crude oil without needing to buy, store, or take delivery of oil.
In other words, an oil CFD is a contract that allows traders to exchange the difference in the price of oil between the time a position is opened and when it is closed. If the price moves in the direction you anticipated, the difference may result in a potential profit. If it moves the other way, it could lead to a loss.
CFDs in general, including oil CFDs, can be traded in either direction.
- If a trader expects oil prices to rise, they may open a long position.
- If they believe prices could decline, they may open a short position.
While dealing with CFDs, the focus is entirely on price speculation rather than physical ownership.
Oil Benchmarks Used in CFD Trading
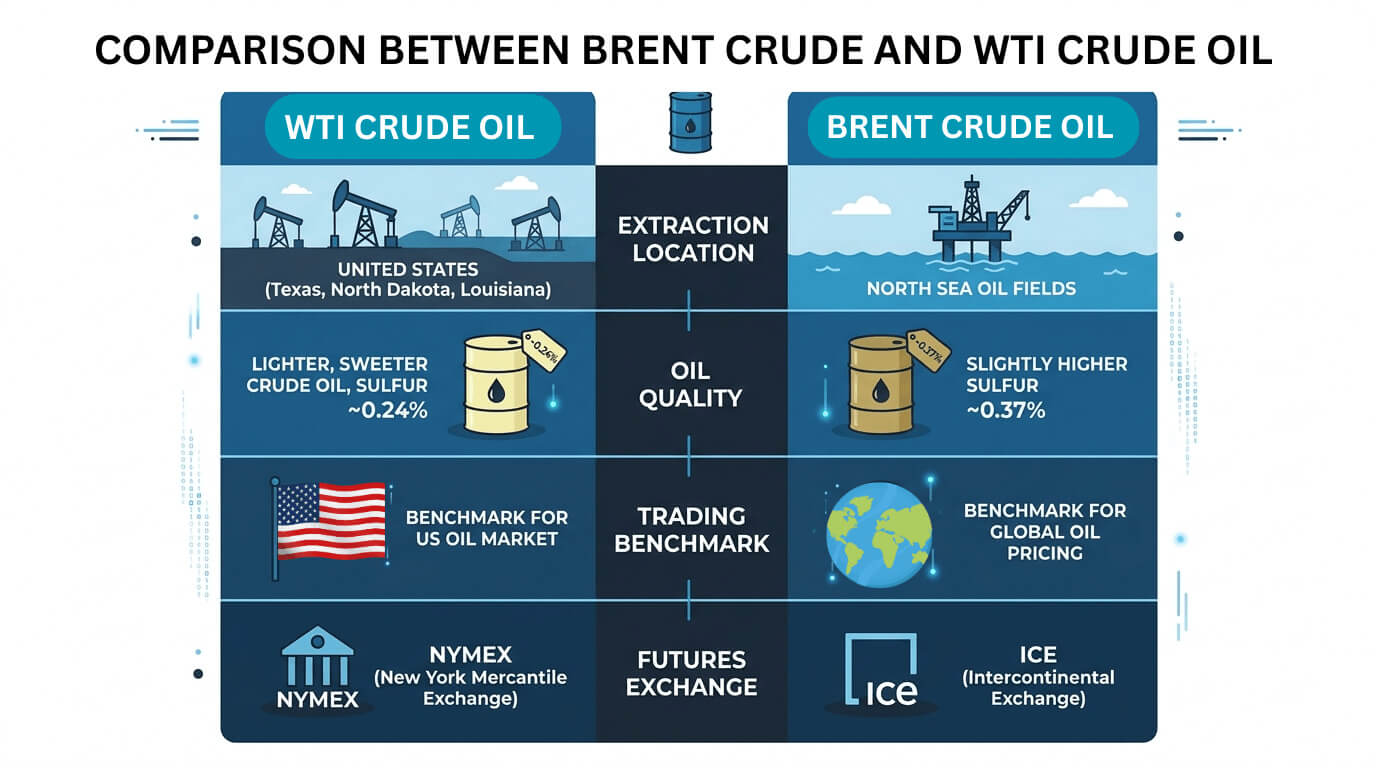
Most oil CFDs track the price of oil benchmarks such as Brent Crude Oil and West Texas Intermediate (WTI).
If you check oil prices on a trading platform, you may notice that Brent and WTI don’t always trade at exactly the same price. Sometimes Brent may be slightly higher, while at other times WTI might trade at a premium. This kind of difference is fairly normal in the oil market.
Although both benchmarks reflect global crude oil market conditions, they originate from different regions and differ slightly in terms of grade, which refers to the quality and composition of the oil. However, grade is only one piece of the puzzle. Several other factors also influence oil prices at any given time.
Brent Crude is extracted from oil fields in the North Sea, while WTI is extracted in Texas and North Dakota in the U.S. Because these oils are extracted, transported, and refined in different parts of the world, regional supply and demand may influence their prices.
Furthermore, geopolitical tensions in the regions where these oils are produced may also influence how the two benchmarks are priced in the market.
What Affects Oil CFD Prices?
Oil CFDs track oil prices that are frequently changing - day by day, minute by minute and are influenced by a wide range of factors.
Here are the main ones to consider:
- Increase or decrease in supply by the oil producers
- Increase or decrease in demand by the oil users and importers
- Subsidies for oil companies or other energy companies
- International politics (agreements made between countries)
- Internal politics of an oil producer
- Competition from other energy sources
- Geopolitical tensions and insecurity (tend to increase prices)
- Usage of oil and its fundamental outlook
Let's look at three significant ones from the above list:
1. Oil Supply: Production, Reserves, and Output Decisions
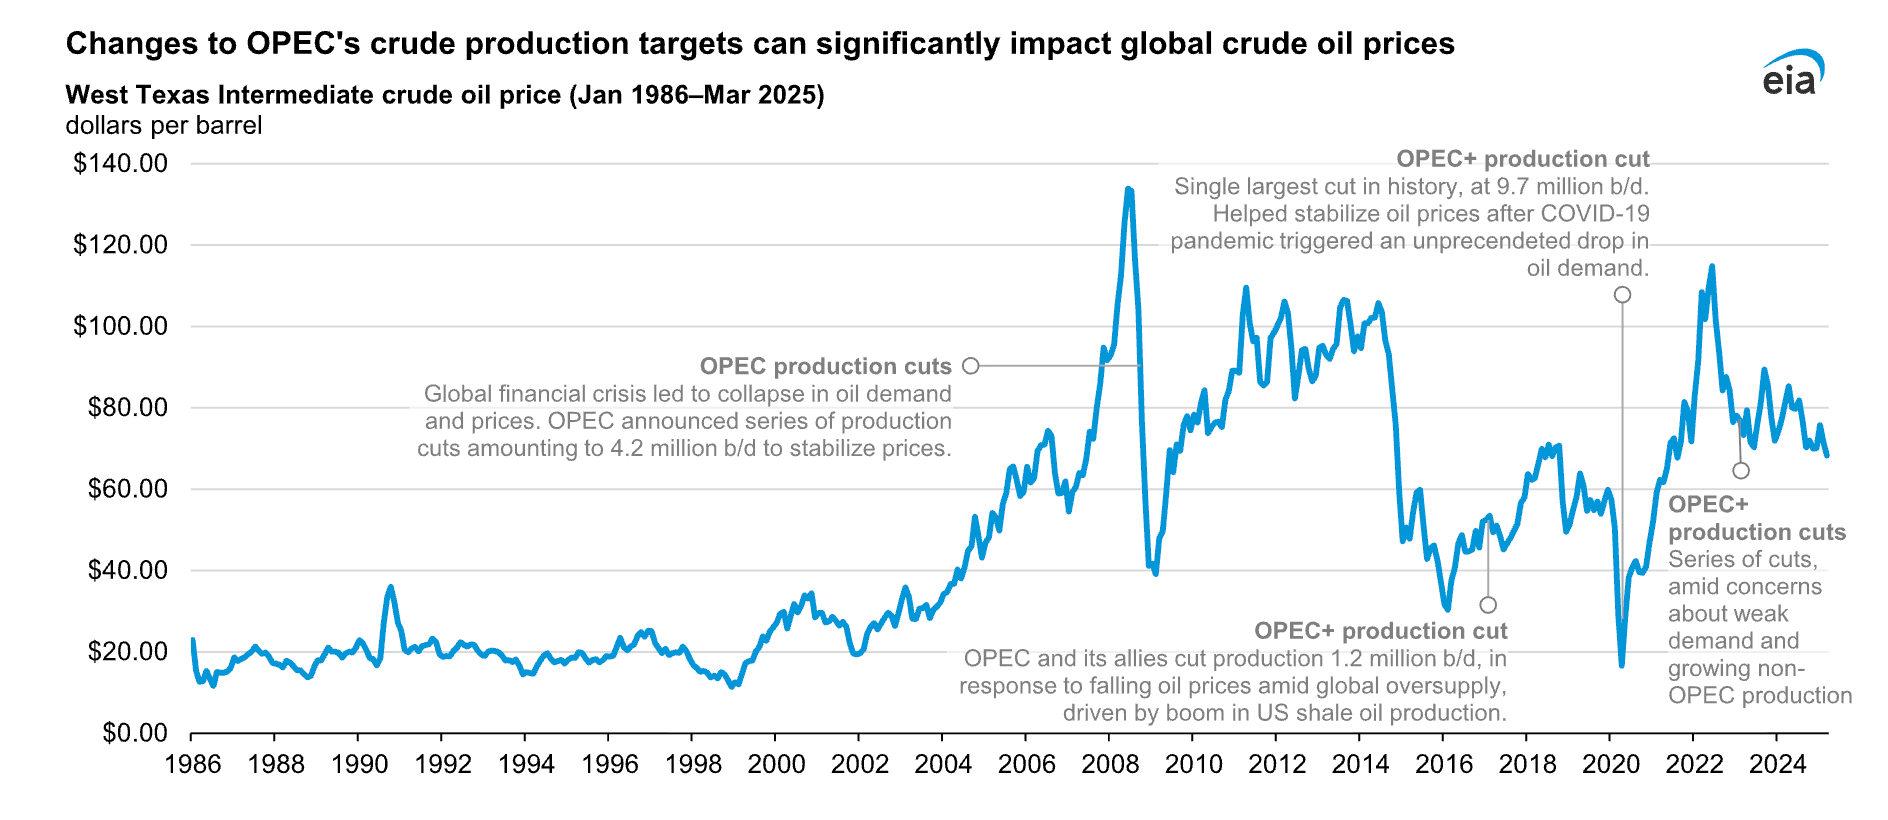
Oil is a resource that is not located in every country, and hence the production of oil is concentrated. Oil is produced in 100 countries, which is about half of the world. The exports of OPEC, an intergovernmental organisation of major oil-producing nations that coordinate oil production policies, account for around 50% of the oil traded internationally. This gives these oil-producing countries and oil associations (such as OPEC) more power to control their supply and impact price.
They may decrease their oil production to stop prices from falling or to help increase them. They can also increase their oil production if they believe the price is good (i.e. expensive enough) to sell and make a profit.
The chart below illustrates how changes in production targets have historically coincided with fluctuations in oil prices between January 1986 and March 2025.
2. Oil Demand: Economic Growth and Global Consumption Trends
Demand for oil tends to grow when the global economy is performing well because consumers are buying more products, companies are shipping and transporting more goods (due to higher demand), companies are investing more (to create enough capacity), and consumers are travelling more for business and leisure. A weakening global economy has the opposite effect and may decrease the demand for oil.
3. Geopolitics: Conflict, Policy, and Global Stability
With a few countries producing a significant percentage of the world's total crude oil, tension in one of these nations can cause significant issues with supply. For example, tensions involving the United States and Iran have periodically raised concerns about potential disruptions to oil supply in the Middle East, a region where several OPEC members operate.
Such news can sometimes lead to sharp movements in global oil prices. Because oil CFDs track these price changes, periods of geopolitical uncertainty may create trading opportunities for some traders, although the same volatility may also increase the risk of potential losses.
As a trader, it might be useful to keep an eye on the geopolitical climate surrounding the world’s major oil-producing countries. Many traders monitor oil market reports that provide insight into supply conditions.
How to Trade Oil CFD?
While trading oil CFDs, traders open positions on their trading platform that tracks the price movements of major crude oil benchmarks discussed earlier, such as Brent Crude Oil and West Texas Intermediate (WTI).
In practice, there are a few key elements that traders usually look at before placing a trade.
Oil CFD Contract Sizes
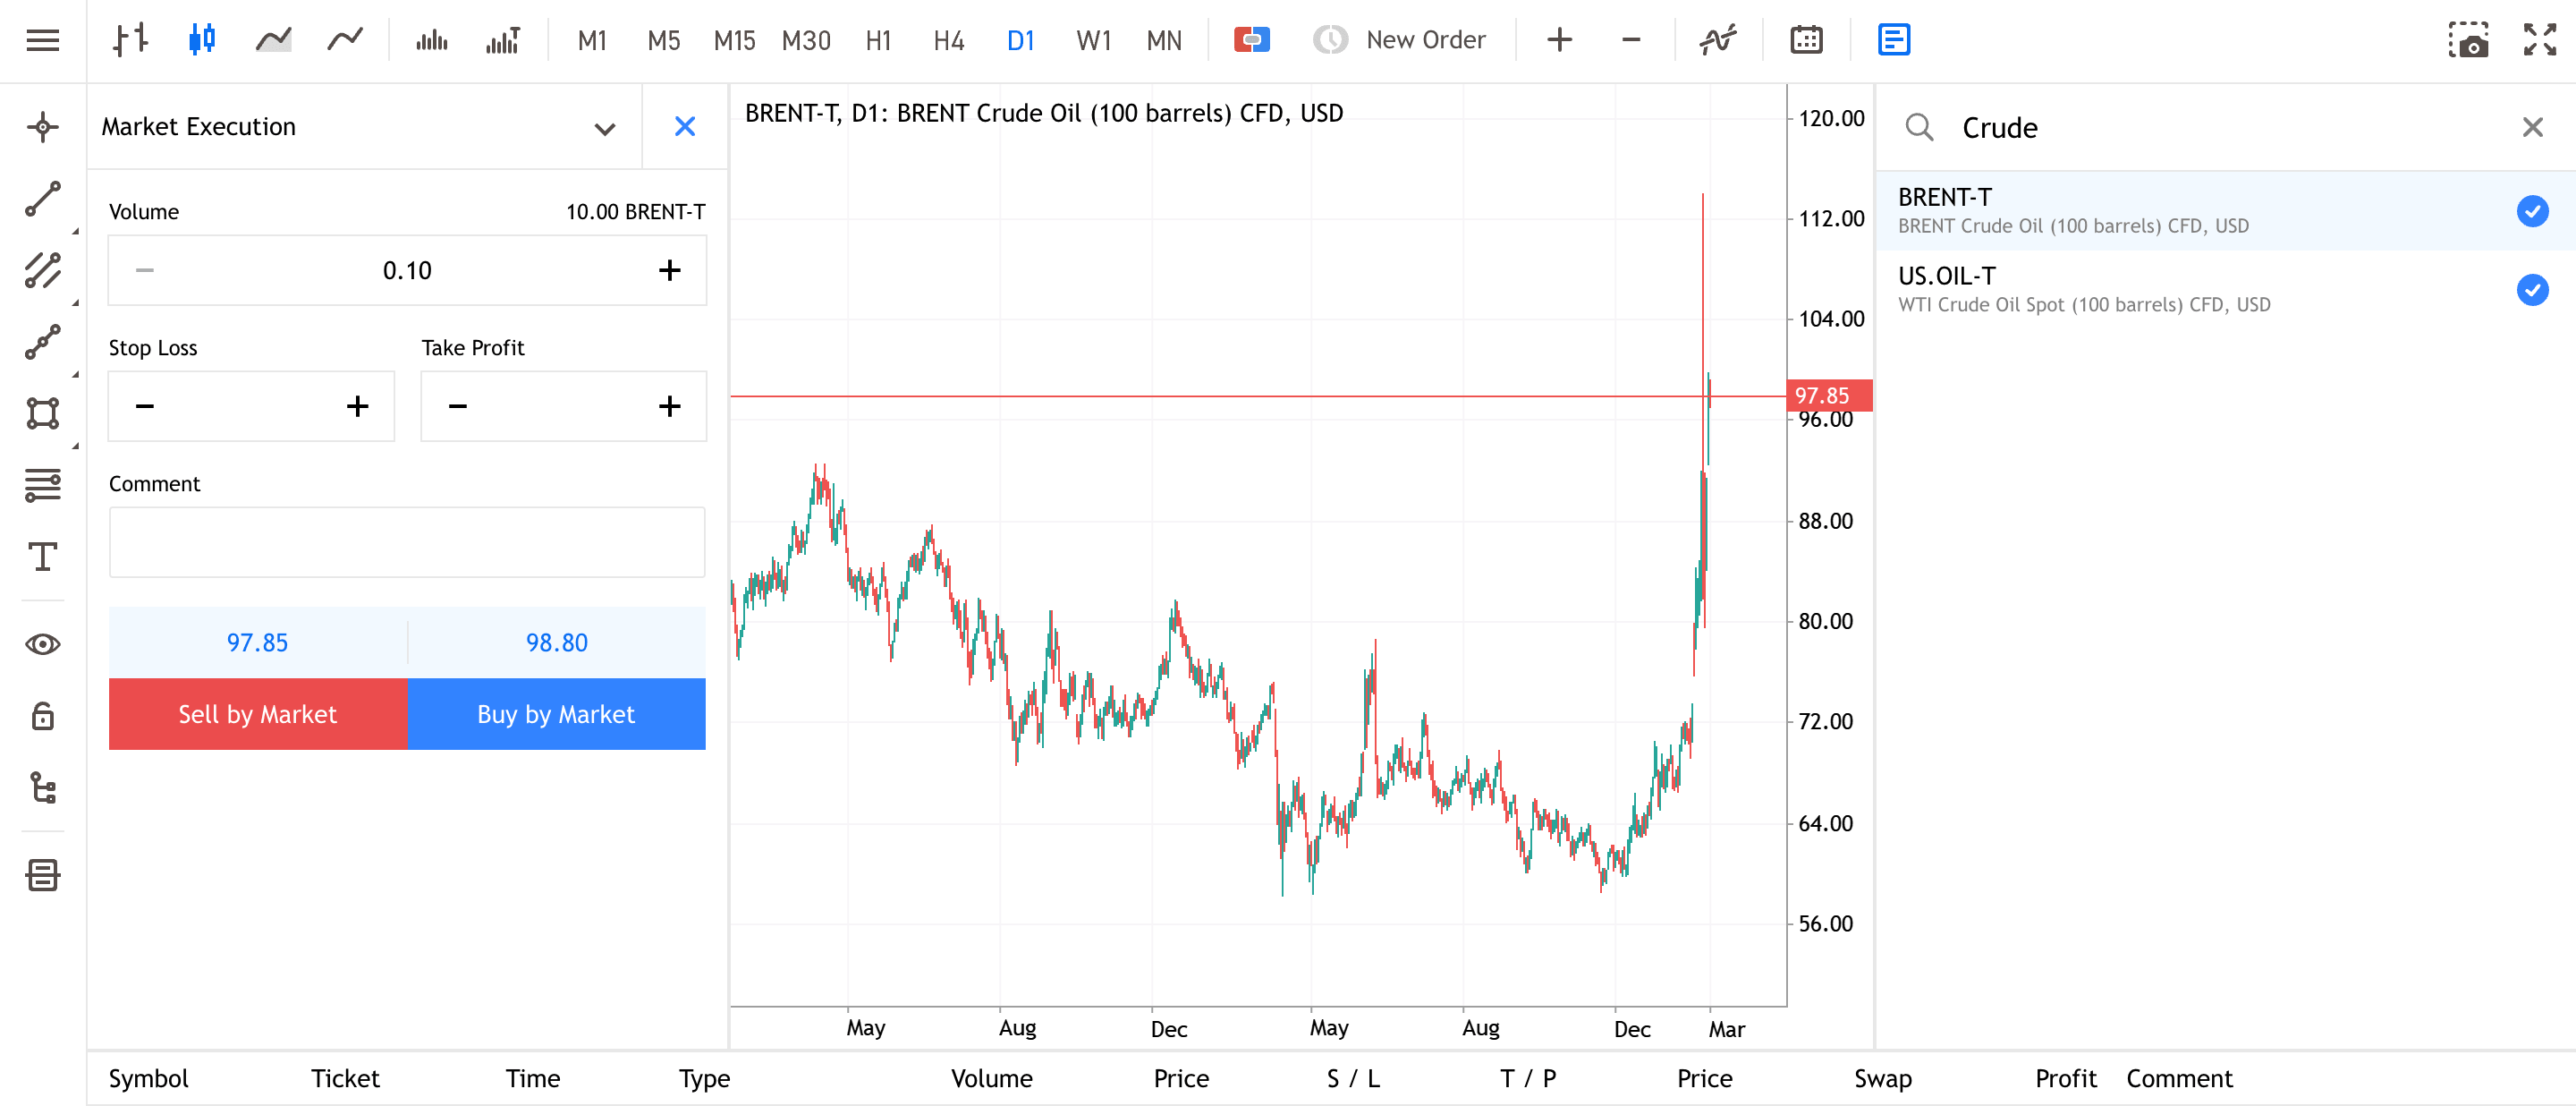
When it comes to the size of the trade, CFD trades are measured in 'lots'. In the case of both WTI and Brent Crude oil, one lot is 100 barrels of oil, which is the standard lot size for oil CFD trading.
To make trading more accessible, MetaTrader also allows fractional lot sizes, such as 0.1 lot.
A 0.1 lot position represents exposure to around 10 barrels of oil, rather than the 100 barrels.
Here’s how a typical contract structure may look like:
Margin and Leverage in Oil CFD Trading
Another key consideration for traders is margin and the level of leverage available.
Margin requirements determine the capital needed to open and maintain a position, while leverage allows traders to increase their market exposure.
However, while leverage can enhance potential returns, it can also amplify losses if the market moves against the position. For this reason, many traders use risk management tools such as stop-loss orders when trading oil CFDs.
Oil CFD Trading Example
Imagine crude oil is trading at $97 per barrel and a trader decides to open a 1 lot position, which represents 100 barrels of the UK crude oil CFD.
However, when trading CFDs, you typically require a margin deposit, which allows you to control the larger position through leverage.
Here’s how your position would look like:
In this scenario, the trader may only need to deposit a margin of $19.40 to control a position worth $9,700. This is made possible because of leverage, although the exact leverage available will depend on the broker and regulatory conditions. So, a $1 change in price would result in:
In addition to commission, if the trader holds the position overnight, an additional swap charge may apply. This is an interest rate adjustment that is charged for holding long positions beyond a trading day. Note that for short positions, though, you might get paid interest.
To check the margin requirements and leverage for Admirals, kindly refer to our Contract Specifications page.
Strategies and Approaches for Oil CFD Trading
Well, there is no single way to approach oil CFD trading. Traders involved in CFD oil trading often use a combination of market analytics and trading styles to evaluate potential opportunities in the market.
Oil CFD Trading Strategy #1: News-Driven Trading
Traders often build trading strategies based on factors that influence oil prices.
For example, they often pay attention to reports like the weekly petroleum inventory released by the EIA every Wednesday. This report provides data on U.S. crude oil stockpiles.
Taking this as an example, the data may be interpreted in different ways:
- Falling inventory may sometimes be seen as a sign of stronger demand or tighter supply conditions.
- Rising inventory may be interpreted as suggesting that supply is currently exceeding demand.
Based on this data or expectations around the release, some traders may choose to open positions as the market reacts once the information becomes public. However, it is important to remember that such news outcomes are only one of many factors that might influence oil prices. So, it’s not certain that markets will move as anticipated.
Oil CFD Trading Strategy #2: Technical Analysis using a CCI Indicator
Another popular approach used in oil CFD trading involves technical analysis. Using technicals is not just limited to short-term trading; one may combine it with fundamentals to better plan entry and exit levels.
Some market participants look at higher-timeframe charts, such as daily or weekly charts to capture wave patterns when analysing broader price trends. While others may focus on shorter timeframes to look for quicker entry and exit points.
One indicator sometimes used in commodity markets is the Commodity Channel Index (CCI). The indicator typically moves above and below a central zero line and often fluctuates within a range of +100 to −100.
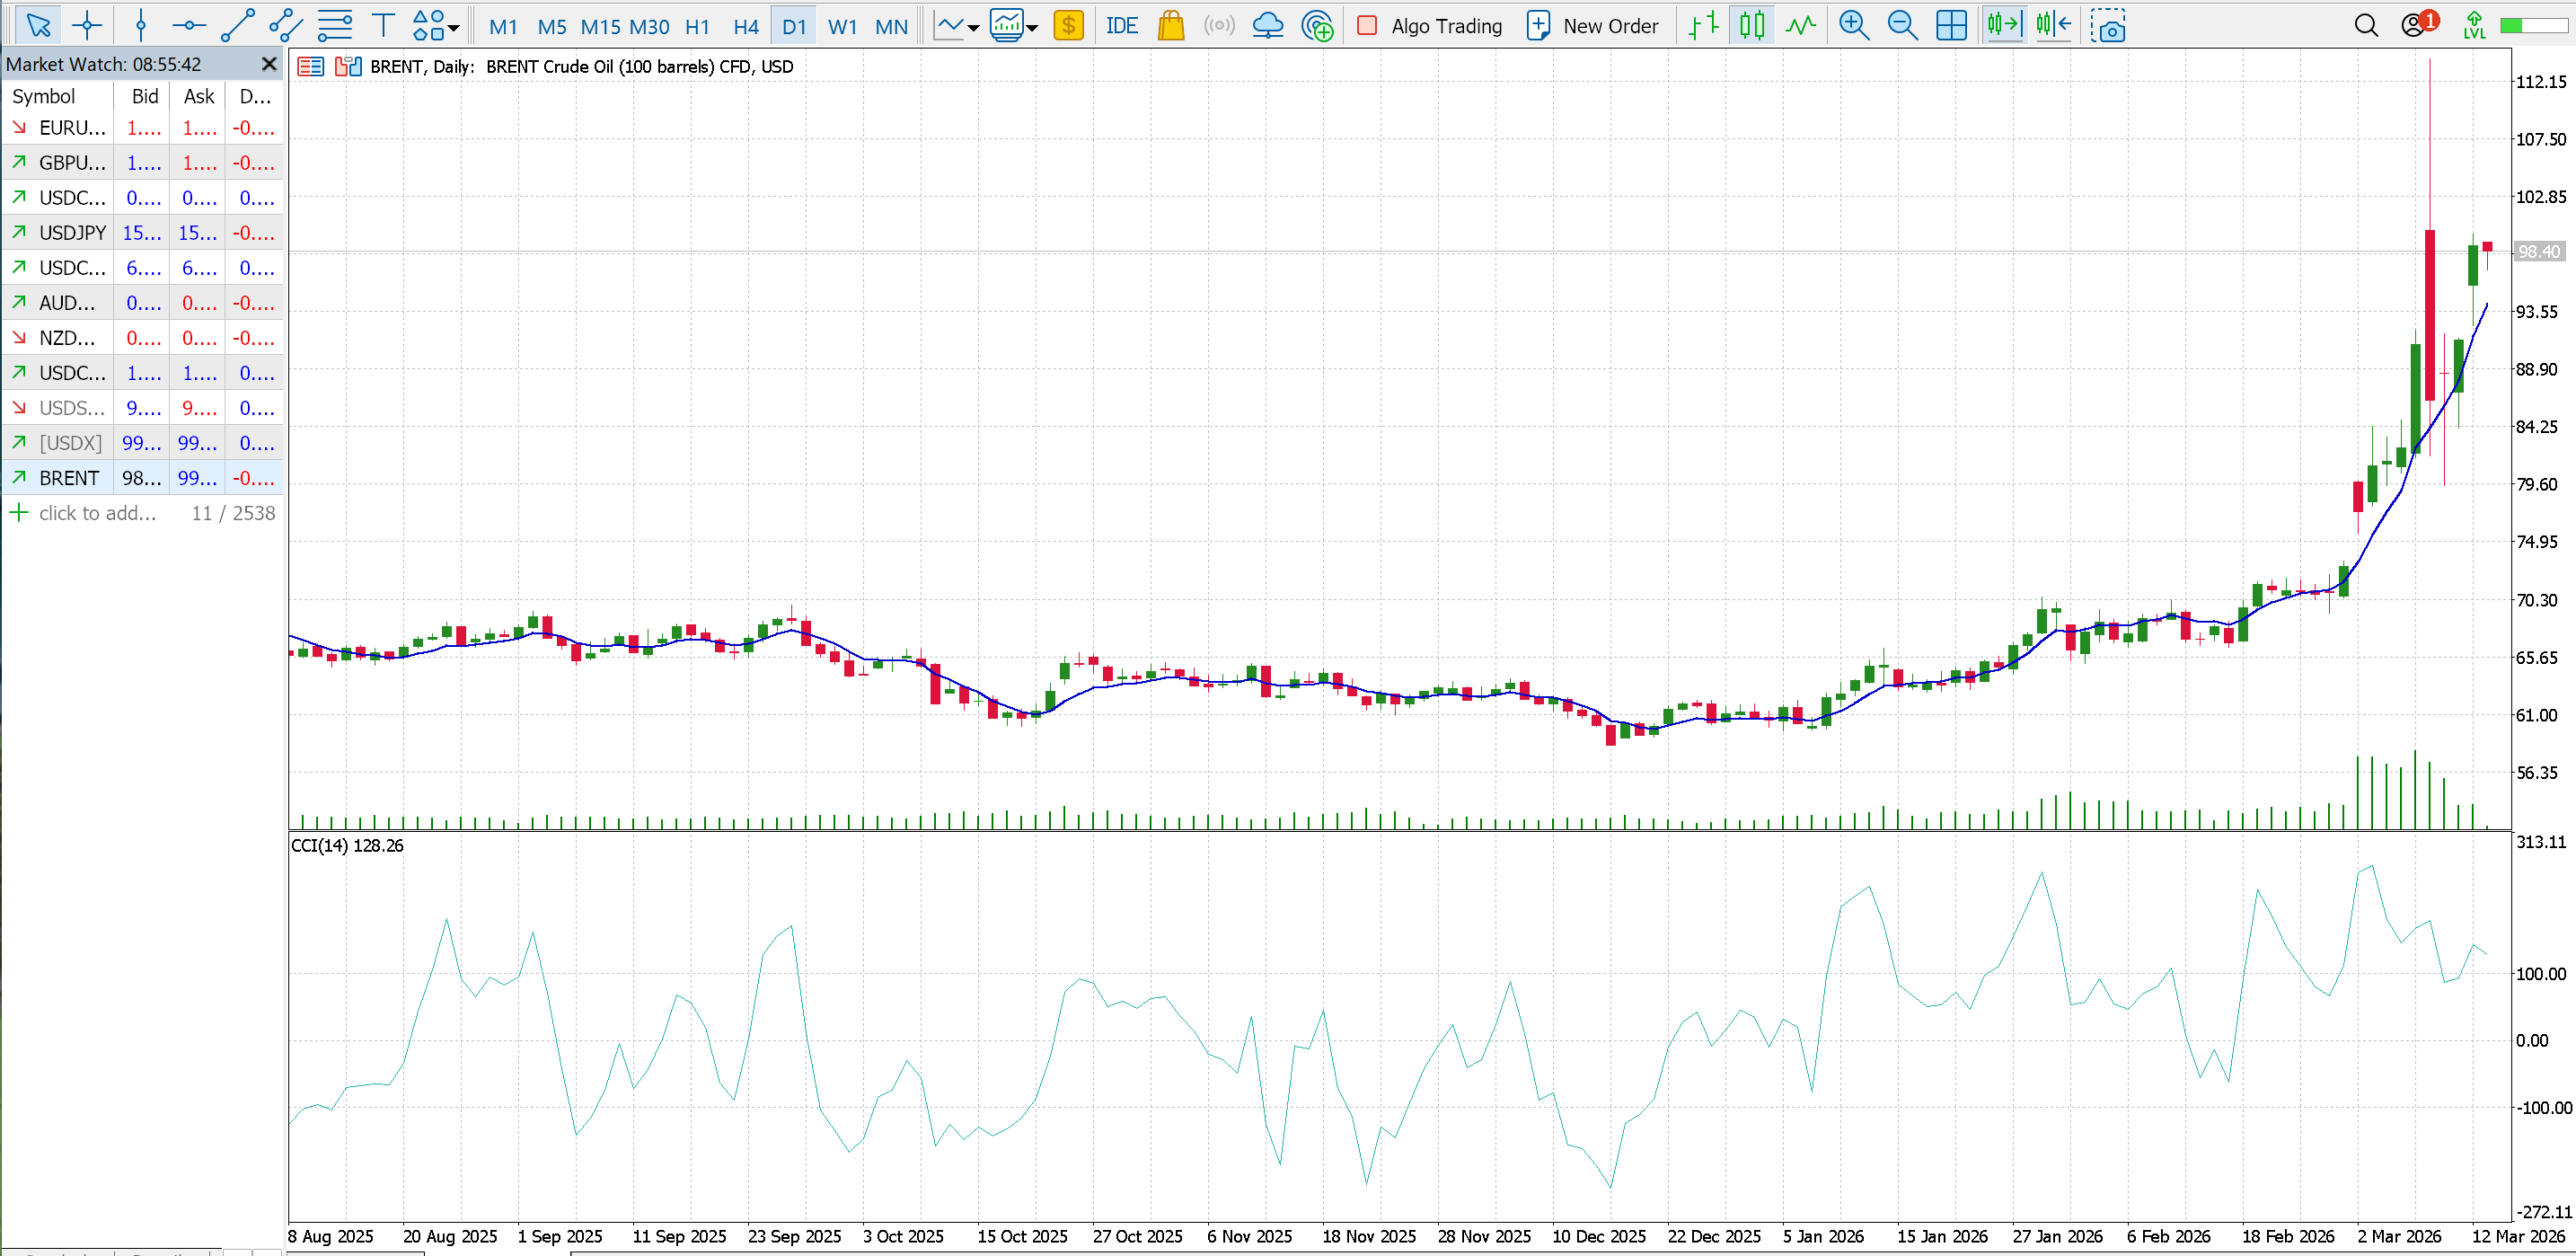
Depicted: Admirals MetaTrader 5, Brent Crude CFD, daily chart with the CCI indicator and moving average, plotted on the chart. Date range: 8th August 2025 to 13th March 2026. Date captured: 13th March 2026. Past performance is not a reliable indicator of future results. For informational purposes only.
When the indicator moves outside this range (-100 and +100), some traders might interpret it as a sign that price momentum may be strengthening or weakening. However, one should never rely on an indicator alone and often looks for confirmation signals by combining them with other tools or price-action signals such as moving averages, Fibonacci retracement levels, and momentum oscillators.
Risk Management for Oil CFD Trading
No matter which instrument you trade, risk management is non-negotiable. This is why many traders try to build a trading plan that helps them manage exposure while trading. Some common considerations may include:
- Deciding how much you are willing to risk per trade. This can help prevent taking an oversized position and allows you to risk only a small portion of your capital on any single trade.
- Trading with a stop loss helps limit potential losses by automatically closing a position if the price moves against your expectations. A few traders also use a trailing stop loss, which trails further as the price moves in your favour.
- It is generally helpful to analyse charts using timeframes that align with your trading style. Frequently changing parameters may create false signals, and entering trades without a clear plan may increase risk.
- CFDs are leveraged products, and while leverage helps you take a larger position, it can also increase risk if prices move in the opposite direction. So, it is recommended to trade on the live markets only when you are aware of the risks involved.
The Bottomline on Oil CFDs
By now, you know that oil CFDs allow traders to participate in crude oil price movements without owning the physical commodity. However, because oil markets can be volatile and CFDs involve leverage, it may be helpful to first understand the factors that influence oil prices and practise different approaches in a demo environment before trading in live markets.
Other articles you may find interesting:
Frequently Asked Questions about Oil CFDs
What is a CFD on crude oil?
A crude oil CFD is a financial derivative instrument that allows traders to speculate on the price movements of crude oil without owning the physical commodity.
What happens to an oil CFD if oil prices go up?
If oil prices rise and a trader has opened a long position, the price movement may result in a potential profit, depending on trading costs. However, if the trader has a short position, a rising oil price could lead to a loss.
What is the best indicator for crude oil?
There is no single best indicator that works for all traders. Some traders use tools such as moving averages, RSI, or the Commodity Channel Index (CCI) to analyse price movements based on their strategy. Often, indicators are combined with other forms of analysis to build a more balanced view of the market. price movements based on their strategy. Often, indicators are combined with other forms of analysis to build a more balanced view of the market.
Oil CFD vs futures: What’s the difference?
The main difference between crude oil futures and CFDs lies in the structure and trading of contracts. Oil CFDs offer flexible position sizes and generally do not require traders to deal with contract expiry for futures rollover. Oil futures, on the other hand, are standardised contracts traded on exchanges with fixed contract sizes and specific expiry dates. Contracts traded on exchanges with fixed contract sizes and specific expiry dates.
About Admirals
Admirals is a multi-award-winning, regulated Forex and CFD broker, offering trading on over 8,000 financial instruments via the world's most popular trading platforms: MetaTrader 4 and MetaTrader 5.
The given data provides additional information regarding all analysis, estimates, prognosis, forecasts, market reviews, weekly outlooks or other similar assessments or information (hereinafter “Analysis”) published on the websites of Admirals investment firms operating under the Admirals trademark (hereinafter “Admirals”) Before making any investment decisions please pay close attention to the following:
- This is a marketing communication. The content is published for informative purposes only and is in no way to be construed as investment advice or recommendation. It has not been prepared in accordance with legal requirements designed to promote the independence of investment research, and that it is not subject to any prohibition on dealing ahead of the dissemination of investment research.
- Any investment decision is made by each client alone whereas Admirals shall not be responsible for any loss or damage arising from any such decision, whether or not based on the content.
- With view to protecting the interests of our clients and the objectivity of the Analysis, Admirals has established relevant internal procedures for prevention and management of conflicts of interest.
- The Analysis is prepared by an analyst (hereinafter “Author”). The Author Amrita Kundu is a contractor for Admirals. This content is a marketing communication and does not constitute independent financial research.
- Whilst every reasonable effort is taken to ensure that all sources of the content are reliable and that all information is presented, as much as possible, in an understandable, timely, precise and complete manner, Admirals does not guarantee the accuracy or completeness of any information contained within the Analysis.
- Any kind of past or modelled performance of financial instruments indicated within the content should not be construed as an express or implied promise, guarantee or implication by Admirals for any future performance. The value of the financial instrument may both increase and decrease and the preservation of the asset value is not guaranteed.
- Leveraged products (including contracts for difference) are speculative in nature and may result in losses or profit. Before you start trading, please ensure that you fully understand the risks involved.