The Best Performing Assets Since the Collapse of Lehman Brothers
It's been 11 years since the global financial crisis (GFC). The crisis was triggered by a collapse in the US financial system. The after-effect was a deep recession, and an almost full breakdown of the financial system.
How It All Began
The GFC started with the US housing bubble, where home prices peaked in 2005 and 2006. While housing prices climbed, borrowers were incentivised to buy more property with generous incentives and contract terms. In some cases, this encouraged borrowers to take on mortgages they would not be able to repay, on the assumption that housing prices would continue to climb and they would then be able to have the loan refinanced based on the new value of the property.
When it comes to the financial markets, these mortgages (known as 'subprime' mortgages) were repackaged into financial instruments (known as mortgage-backed securities and collateralised debt obligations) that could be used for investments, and were often mixed with traditional mortgages. This then increased the risk of these investments as a whole.
As property prices stopped climbing, the number of borrowers who defaulted was continually rising. All repackaged mortgage investments became toxic, the demand declined and their value started to fall. Consequently, banks became very apprehensive about lending to one another. The supply of credit in the US and around the globe began to dry up, and the investment arms of many large financial institutions began to collapse. The rest, as they say, is history.
Lehman Brothers: The trigger for the GFC?
When many people think about the GFC, the moment that seems to have started it all was the collapse of Lehman Brothers Holdings Inc., a global financial services company.
On September 15, 2008, Lehman Brothers filed the largest bankruptcy claim in US history, after dramatic falls in its stock price, its devaluation by credit rating agencies, and the loss of most of its clients, all of which were largely contributed by the subprime mortgage crisis. This was followed by a run on market fund assets, after it was discovered that Lehman's investors would not make their money back, until the US Fed promised to guarantee these assets going forward.
The day after Lehman Brothers' collapse, the Fed bailed out AIG and, in the following weeks, Congress passed the Troubled Asset Relief Program to stabilise the financial system. While the collapse of Lehman Brothers can seem like the trigger for the financial crisis in retrospect, and was often treated as the trigger by the media, the truth is that this event had been years in the making.
The Immediate Effect of the GFC
According to various sources, real GDP in the US fell $650 billion (4.3%) in 2008 and 2009, and did not recover its $15 trillion pre-recession level until the third quarter of 2011.
Household net worth (which reflects the value of both stock markets and housing prices) fell $11.5 trillion (17.3%) and did not regain its pre-recession level of $66.4 trillion until the third quarter of 2012. The number of citizens with jobs (total non-farm payrolls) fell 8.6 million (6.2%) and did not regain the pre-recession level of 138.3 million until May 2014.
The unemployment rate peaked at 10.0% in October 2009 and did not return to its pre-recession level of 4.7% until May 2016.
In Europe
According to the 'International Journal of Business and Social Science', due to the GFC in 2008 and 2009, Hungary, Latvia, and Romania faced a balance of payments crisis so severe that outside financial assistance was necessary. In each case, assistance was offered in the context of a joint IMF (International Monetary Fund)/EU balance plan.
Poland was initially less vulnerable, so avoided the IMF's line of credit, reassuring worldwide capital markets that its liquidity was assured. In Hungary, the response to the GFC was also effective.
In the lack of a precedent, the IMF and the EU operated in an unbureaucratic manner in an attempt to undertake a joint program. The primary goal of the program was to guarantee balance of payments sustainability, to avoid speculative attacks, and to thereby protect the credibility of the financial institutions concerned.
The Best Performing Assets Since the Collapse of Lehman Brothers
Now with the GFC far behind us, a lot of things have changed, including a range of assets performing very well over the past decade. Some of the top performers include:
- FAANGs shares
- Bitcoin
- Real Estate in western countries where there was cheap credit
- US Equities
- Oil
FAANGs
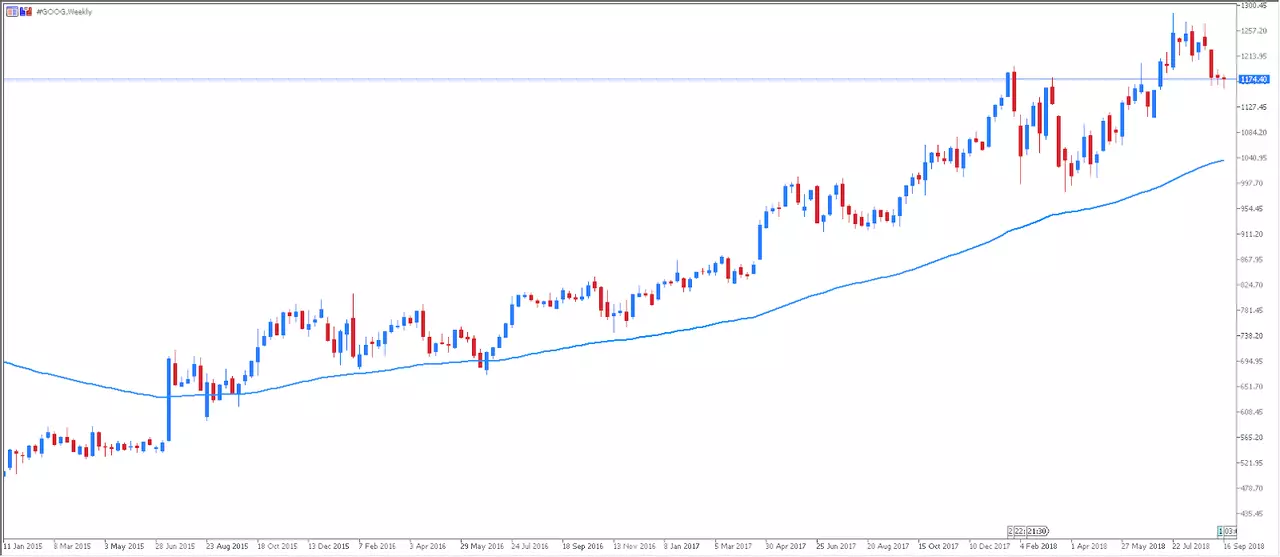
In the UK, only a few assets delivered the best possible returns: consumer staple stocks, IT stocks, and consumer discretionary stocks. In the UK and across the world, those smart enough to invest into IT stocks made a 320.8% return as so-called FAANGs (Facebook, Apple, Amazon, Netflix and Google) enjoyed huge popularity among investors in the UK.
Bitcoin
Bitcoin, the most popular cryptocurrency, has enjoyed an immense growth since the collapse of Lehman Brothers. Bitcoin is a digital currency with a finite supply of digital coins that enables an exchange of funds between two parties, without any third-party intermediary banks or fees. As a result, this technology has become a store of value for investors due to its finite supply, while other flat currencies are continually devalued by increasing money supply. Not only has it become a useful store of funds in the western world, but it has become very useful in economies experiencing heavy currency devaluations, such as Venezuela and Turkey. While Bitcoin was valued around 5 US cents in 2010 per Bitcoin, it peaked around 19,400 USD in December 2017, it then made some gains of 388,000, on top of the initial prices in 2010, but it now trades near 6,380 USD per BitCoin, which is still 127,000 on top of the initial prices in 2010. Admiral Markets offers the ability to trade CFDs on BTCUSD (Bitcoin vs US Dollar) and BCHUSD (Bitcoin Cash vs US Dollar), together with, a range of cryptocurrency CFDs.
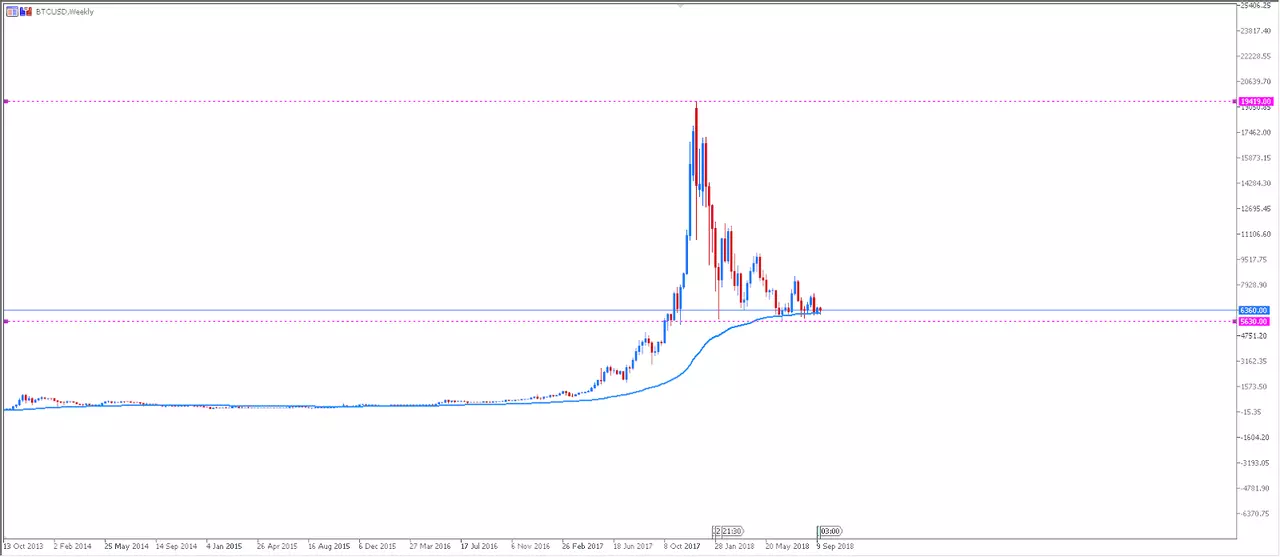
Source: Admiral Markets MT5 , BTC/USD CFD Weekly chart 2013-2018, 21.09.2018 04:00 PM
Oil
Since February 2009, WTI Crude Oil has bottomed amid concerns that the global growth engine was halting as a result of the GFC, to around USD33 per barrel. However, this was short-lived, as some emerging markets and China continued to grow, alongside the massive QE stimulus in Japan and US. Within roughly two years the price, had rallied back to $USD111 per barrel, a near 300% gain in just a few years!
The world then subsequently suffered from an oil crisis due to less demand for oil, owing to new technologies for motor vehicles that do not require oil, along with excess production of oil from new fracking technologies in the USA and Russia, causing it to bottom again at USD$26 per barrel. Despite this, we have seen the oil price rise again amid supply restrictions placed from the OPEC (Organization of the Petroleum Exporting Countries) and issues arising again in the Middle East, namely in Syria, causing it to rise again back above US$70 per barrel.
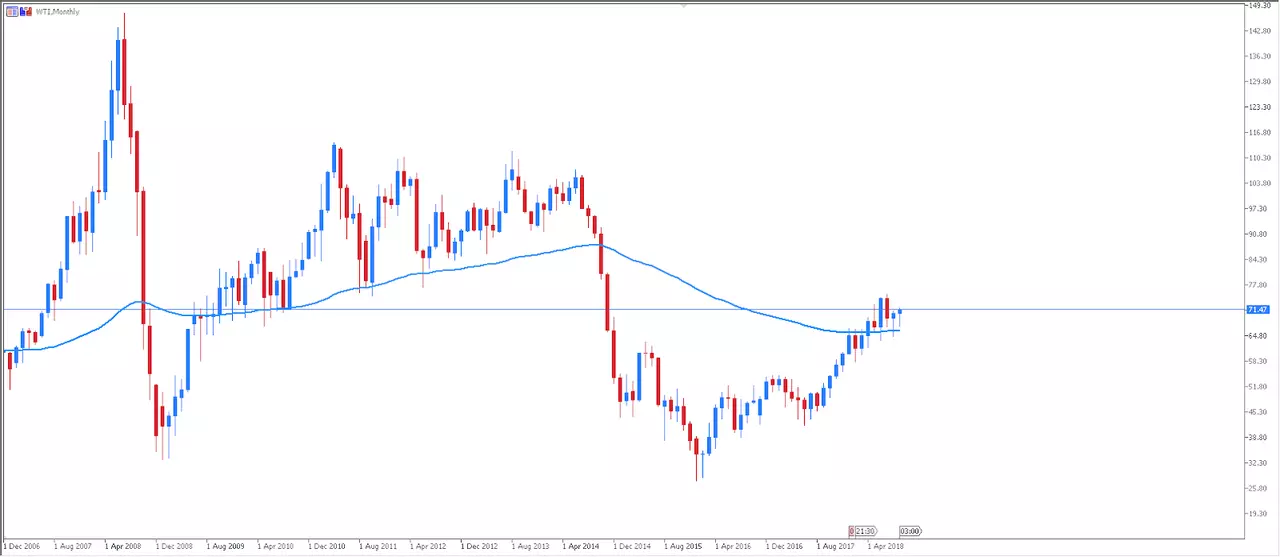
Source: Admiral Markets MT5 , WTI Oil CFD Monthly chart 2006-2018, 21.09.2018 04:00 PM
US Equities
As a result of several years of ultra-loose monetary policy in the USA with its QE programmes, we saw many US listed companies, rather than investing in the future, applying their free cash flow in 'perform share buybacks', thus raising the prices of US stocks to new levels. The Dow Jones for example was below 7000 pts during the lull of the GFC, while reaching a peak OF around 26,600 pts in January 2018.
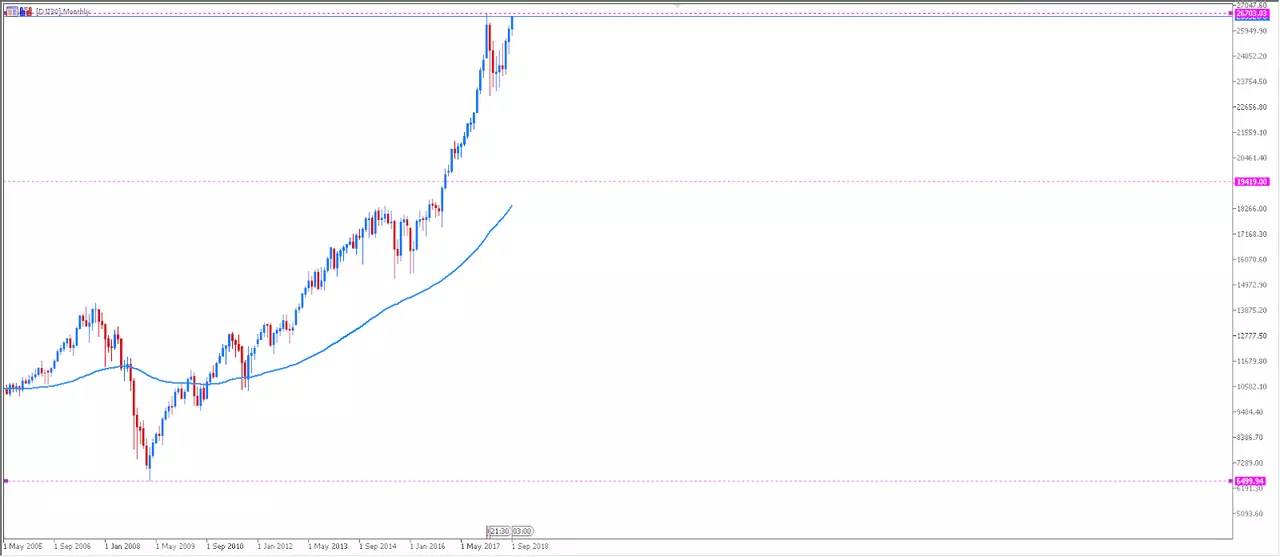
Source: Admiral Markets MT5 , DJI30 CFD Monthly chart 2006-2018, 21.09.2018 04:00 PM
Real Estate
Investing in actual housing has been extremely profitable for nations experiencing loose monetary policy and cheap credit, along with strong population growth and overseas investment.
One example of this has been real estate in Sydney and Melbourne, which has friendly overseas property investor rules, cheap credit, and relative closeness to the booming number of the middle class of China. For example, Median house prices rose from around AUD$400,000 to AUD$880,000 in Melbourne houses alone!
With Admiral Markets you can trade ETF CFDs (Exchange Traded Funds Contract for Differences), and here is a list of the most popular real estate ones:
- iShares U.S. Real Estate ETF CFD (IYR)
- SPDR Dow Jones International Real Estate ETF CFD (RWX)
- Real Estate Select Sector SPDR Fund ETF CFD (XLRE)
- Vanguard REIT ETF CFD (VNQ)
- SPDR Dow Jones Global Real Estate ETF CFD (RWO)
- iShares International Developed Real Estate ETF CFD (IFGL)
- iShares Mortgage Real Estate ETF CFD (REM)
The market coverage on the Invest.MT5 account currently represents the stocks of 265 of the biggest companies in the UK, the US, and the EU. Additionally, Admiral Markets provides historical and real-time market data for all stocks on the live Invest.MT5 account at no extra charge. Furthermore, Admiral Markets is aiming to add substantially more equities in the upcoming months to provide you with further opportunities to expand your investment portfolio. You can find all the details regarding the new instruments on the Invest.MT5 account within the Contract Specifications section of the Admiral Markets website.
This material does not contain and should not be construed as containing investment advice, investment recommendations, an offer of or solicitation for any transactions in financial instruments. Please note that such trading analysis is not a reliable indicator for any current or future performance, as circumstances may change over time. Before making any investment decisions, you should seek advice from independent financial advisors to ensure you understand the risks.

