The value of Chinese factories grow at the best rate in 3 years
Since the coronavirus pandemic began last year, China, despite the fact that the pandemic began there, seems to be recovering among the best.
After the strict measures imposed on its population, China quickly emerged from this crisis and began work on supplying the world with tests and sanitary material manufactured in its factories, putting Beijing and its economy in a dominant position. Demonstrating once again the change in the framework of global geopolitics from the traditional European American alliance to the Asia Pacific, which seems to now be the main battlefield as demonstrated by the trade war initiated by Donald Trump against China.
Last night, we learned that the value of Chinese factories exceeded analysts' expectations by rising higher than expected year-on-year, at a rate not seen since 2018, demonstrating the strength of the Chinese economy despite the current situation. Specifically, this rise was 4.4% compared to the 3.5% expected.
The Chinese economy is one of the great beneficiaries of this crisis, experiencing strong stock market growth. In 2021, the Hang Seng index only rose 5.39%, due to the sharp falls that have occurred since mid-February due to growing tensions between Beijing and the Joe Biden administration.
If we look at the chart, technically speaking, the fall from the highs coincides with the fulfilment of the negative divergence that we can observe on the daily chart between the price and its MACD and Stochastic oscillators, which has led the price to fall back to the 38.2% Fibonacci level of the last upward momentum that began in September 2020.
Despite the good macroeconomic news from the Asian country today, the Hang Seng has fallen by 1.10% after approaching the retracement level of the 23.6% Fibonacci thus supporting its 18-session black moving average.
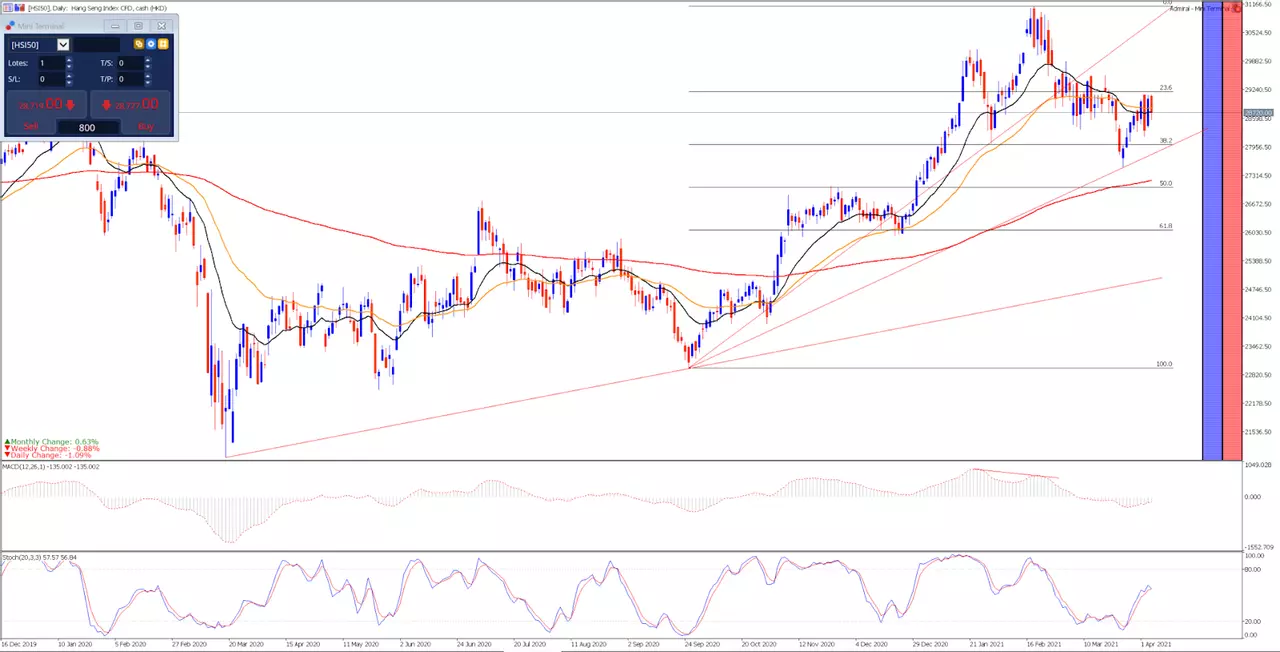
Source: Admiral Markets MetaTrader 5. Moderna daily chart. Data range: from December 16, 2019 to April 9, 2021. Prepared April 9, 2021 at 1:25 p.m. CEST. Keep in mind that past returns do not guarantee future returns.
Price evolution in the last 5 years:
- 2020: -3.40%
- 2019: 9.07%
- 2018: -13.61%
- 2017: 35.99%
- 2016: 0.39%
With the Admiral Markets Trade.MT5 account, you can trade Contracts for Differences (CFDs) of Microsoft and more than 3000 stocks! CFDs allow traders to try to profit from the bull and bear markets, as well as the use of leverage. Click on the following banner to open an account today:
INFORMATION ABOUT ANALYTICAL MATERIALS:
The given data provides additional information regarding all analysis, estimates, prognosis, forecasts, market reviews, weekly outlooks or other similar assessments or information (hereinafter “Analysis”) published on the websites of Admiral Markets investment firms operating under the Admiral Markets trademark (hereinafter “Admiral Markets”) Before making any investment decisions please pay close attention to the following:
- This is a marketing communication. The content is published for informative purposes only and is in no way to be construed as investment advice or recommendation. It has not been prepared in accordance with legal requirements designed to promote the independence of investment research, and that it is not subject to any prohibition on dealing ahead of the dissemination of investment research.
- Any investment decision is made by each client alone whereas Admiral Markets shall not be responsible for any loss or damage arising from any such decision, whether or not based on the content.
- With view to protecting the interests of our clients and the objectivity of the Analysis, Admiral Markets has established relevant internal procedures for prevention and management of conflicts of interest.
- The Analysis is prepared by an independent analyst, Roberto Rojas (analyst), (hereinafter “Author”) based on their personal estimations.
- Whilst every reasonable effort is taken to ensure that all sources of the content are reliable and that all information is presented, as much as possible, in an understandable, timely, precise and complete manner, Admiral Markets does not guarantee the accuracy or completeness of any information contained within the Analysis.
- Any kind of past or modeled performance of financial instruments indicated within the content should not be construed as an express or implied promise, guarantee or implication by Admiral Markets for any future performance. The value of the financial instrument may both increase and decrease and the preservation of the asset value is not guaranteed.
- Leveraged products (including contracts for difference) are speculative in nature and may result in losses or profit. Before you start trading, please ensure that you fully understand the risks involved.

