Credit crunch and liquidation put pressure on Gold – bulls wait for their chance

The Coronavirus pandemic and as a result nearly complete shutdown of the global economy has resulted in a broad risk-off mode and massive de-leveraging, resulting in Equities respectively the SP500 CFD suffering its quickest descent into a bear market on record.
What probably comes as a surprise to most investors is that Gold, which is a classic safe-haven asset class, and is in aggressive demand during market turmoil, saw a massive drop, as well.
There may be more surprises to come, because after the Fed delivered two emergency rate cuts within two weeks (on the third and 15th of March), and the interest rate level being 0.00 – 0.25%, the launch of a massive QE program of USD 700 billion, and swap lines with global central banks to make sure that that enough USD is available while cutting bank reserve ratios for banks to 0.
Gold experiencing such massive selling pressure doesn't seem to make sense at first glance, but it does point to massive stress to come.
Why Gold is currently under pressure
One of the key drivers of recent volatility in Equity markets and classic "safe-haven" assets like Gold results out of a credit crunch and liquidating nearly everything to stay solvent.
This can especially be seen in the installation of swap lines which were mentioned in the Fed emergency statement on March 15, but the announcement on Thursday, March 19, where the Fed announced the establishment of temporary USD swap lines with Australia, Brazil, Denmark, Korea, Mexico, Norway, New Zealand, Singapore and Sweden.
This step is to make sure that global central banks have enough USD available.
In more detail: the reserve ratio system in the banking sector has led to an enormous pile of 12.8 trillion USD debt which was accumulated over the years (especially over the last decade with the massive Fed QE) and which now can be found in the books of banks around the globe.
With more and more investors demanding US dollars (what can undoubtedly be seen in the significant move higher in the USD Index Future over the last week), it should be expected that the pressure on credit markets stays high, and will continue to result in further liquidations in Gold, in our opinion.
What should we expect for Gold and how to trade it?
The current drop in Gold reminds of the drop during the financial crisis in 2008 where a deflationary shock resulted out of the credit crunch, resulting in a negative impact on the precious metal in the short-term.
Still, after the dust had settled a little, we saw a massive move up from 2010 onwards – and this development could repeat this time again, probably even more aggressive and way beyond 2,000 USD/ounce.
So, while in the mid- to long-term, the mode in Gold stays bullish, especially after the March 23 Fed announcement of "QE Infinity", a short-term a drop below 1,440/450 USD would technically darken the picture, activating 1,250/260 USD as a first target.
In fact, after a first attack over the last days, we got to see a sharp bounce, but still expect another leg lower.
Still, Gold traders should carefully watch the developments in the precious metal, and first signs of a bullish long sequence against the region around 1,240/250 could be interesting from a risk-reward perspective and with the expectation of a sharp rise of as high as 2,000 and beyond in the next 12 to 18 months:
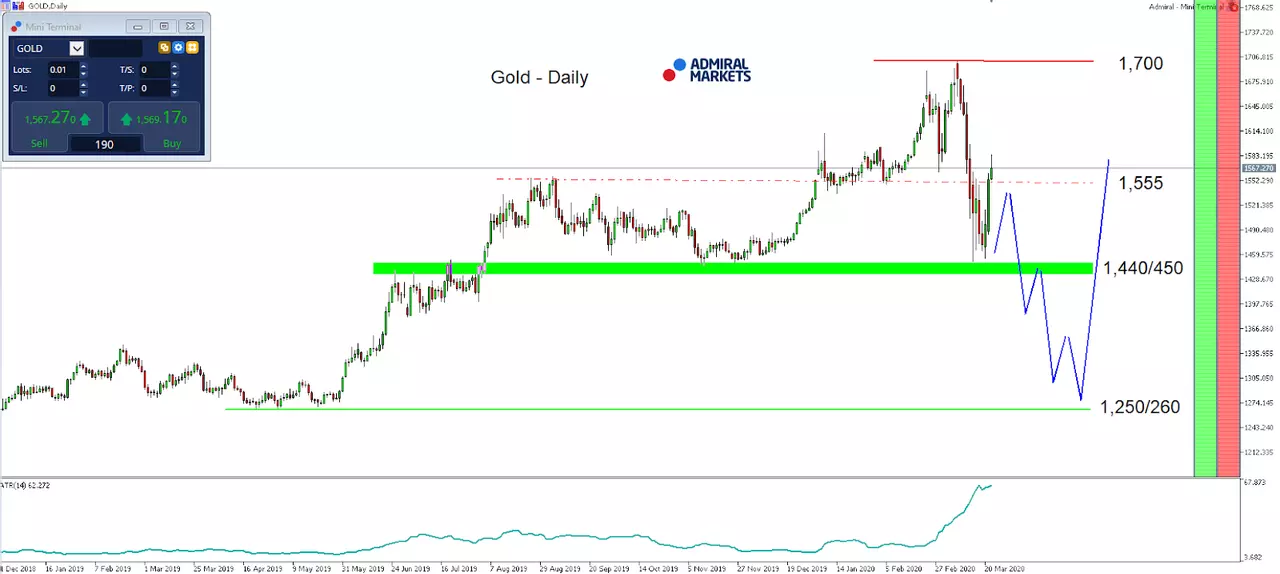
Source: Admiral Markets MT5 with MT5-SE Add-on Gold Daily chart (between December 20, 2018, to March 24, 2020). Accessed: March 24, 2020, at 07:30pm GMT - Please note: Past performance is not a reliable indicator of future results, or future performance.
In 2015, the value of Gold fell by 10.4%, in 2016, it increased by 8.1%, in 2017, it increased by 13.1%, in 2018, it fell by 1.6%, in 2019, it increased by 18.9%, meaning that after five years, it was up by 28%.
Discover the world's #1 multi-asset platform
Admiral Markets offers professional traders the ability to trade with a custom, upgraded version of MetaTrader 5, allowing you to experience trading at a significantly higher, more rewarding level. Experience benefits such as the addition of the Market Heat Map, so you can compare various currency pairs to see which ones might be lucrative investments, access real-time trading data, and so much more. Click the banner below to start your FREE download of MT5 Supreme Edition!
Disclaimer: The given data provides additional information regarding all analysis, estimates, prognosis, forecasts or other similar assessments or information (hereinafter "Analysis") published on the website of Admiral Markets. Before making any investment decisions please pay close attention to the following:
- This is a marketing communication. The analysis is published for informative purposes only and are in no way to be construed as investment advice or recommendation. It has not been prepared in accordance with legal requirements designed to promote the independence of investment research, and that it is not subject to any prohibition on dealing ahead of the dissemination of investment research.
- Any investment decision is made by each client alone whereas Admiral Markets shall not be responsible for any loss or damage arising from any such decision, whether or not based on the Analysis.
- Each of the Analysis is prepared by an independent analyst (Jens Klatt, Professional Trader and Analyst, hereinafter "Author") based on the Author's personal estimations.
- To ensure that the interests of the clients would be protected and objectivity of the Analysis would not be damaged Admiral Markets has established relevant internal procedures for prevention and management of conflicts of interest.
- Whilst every reasonable effort is taken to ensure that all sources of the Analysis are reliable and that all information is presented, as much as possible, in an understandable, timely, precise and complete manner, Admiral Markets does not guarantee the accuracy or completeness of any information contained within the Analysis. The presented figures refer that refer to any past performance is not a reliable indicator of future results.
- The contents of the Analysis should not be construed as an express or implied promise, guarantee or implication by Admiral Markets that the client shall profit from the strategies therein or that losses in connection therewith may or shall be limited.
- Any kind of previous or modeled performance of financial instruments indicated within the Publication should not be construed as an express or implied promise, guarantee or implication by Admiral Markets for any future performance. The value of the financial instrument may both increase and decrease and the preservation of the asset value is not guaranteed.
- The projections included in the Analysis may be subject to additional fees, taxes or other charges, depending on the subject of the Publication. The price list applicable to the services provided by Admiral Markets is publicly available from the website of Admiral Markets.
- Leveraged products (including contracts for difference) are speculative in nature and may result in losses or profit. Before you start trading, you should make sure that you understand all the risks.