Bollinger Bands ® with Admiral Keltner Breakout Strategy
Bollinger Bands are a very popular indicator. Today, I will share a strategy with you that is based on Bollinger Bands and, in my opinion, the best Keltner Channel indicator that can be easily downloaded with MT4 Supreme Edition.
The Bollinger Bands with Admiral Keltner Breakout Strategy is a volatility strategy. It actually starts with an unusual lack of volatility for the market you are trading. In other words, a market is trading with much less volatility than usual judging by the market's historical data.
What is the Bollinger Bands with Admiral Keltner Breakout Strategy?
The focal point of this trading strategy is that it relies on the premise that Forex, indices, and stocks fluctuate between periods of high and low volatility. When periods of low volatility occur, a market should eventually revert back to its normal level of volatility.
This strategy uses two indicators applied on the chart:
- Bollinger Bands
- Admiral Markets Keltner
With both Bollinger Bands and Admiral Keltner, I choose default settings that are used on the vast majority of the trading platforms I've seen:
Bollinger Bands: Length 20, Standard Deviation 2
Keltner Channels: Length 20
However, there are two versions of the Keltner Channels that are commonly used. In my opinion, the Admiral Keltner Channel indicator, available in MetaTrader Supreme Edition, is possibly the best version of the indicator in the open market because the bands are derived from the Average True Range.
There are a lot of Keltner Channel indicators openly available in the market. However, testing various Keltner Channel indicators, I noticed there were a lot of different versions of the indicator itself.
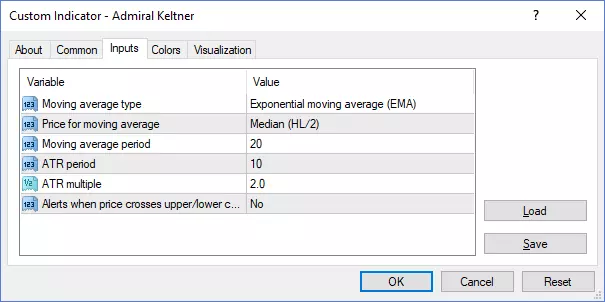
You should not only be sure that you're using the formulation that uses the Average True Range, but also that the centre line is the 20-period exponential moving average. Admiral Markets' Keltner indicator has all the settings coded correctly, which should look as follows:
John Bollinger made Bollinger Bands famous as a trading tool in the early 1980s. A Bollinger Band tells you the amount of volatility given a market relative to the recent past. When a market is very volatile relative to the recent past, the Bollinger Band will expand. When a market is going through a period of low volatility relative to the recent past, the Bollinger Band will contract.
According to John Bollinger, periods of low volatility are often followed by periods of high volatility. Therefore, volatility contraction, or narrowing of the bands, can foreshadow a significant advance or decline. Once the Bollinger Bands with Admiral Keltner Breakout Strategy play is on, a subsequent band break-signals the start of a new move. A new advance starts with a squeeze and subsequent break above the upper band. A new decline starts with a squeeze, and a subsequent break, below the lower band.
Different parameters can be adjusted for Bollinger Bands, such as a period for the simple moving average or the number of standard deviations used. I advise to use the parameters of standard default settings. The settings are as follows:
Bollinger Bands: Length 20, Standard Deviation 2
Statistical Deviation
Now, the statistical term you don't commonly hear in a conversation is "standard deviation".
Understanding this term is the key to understanding how a Bollinger Band detects and displays fluctuations in the degree of volatility. Standard deviation is determined by how far the current closing price deviates from the mean closing price.
The general concept is that the farther the closing price is from the average closing price, the more volatile a market is deemed to be, and vice versa. This is what determines the degree of contraction or expansion of a Bollinger Band.
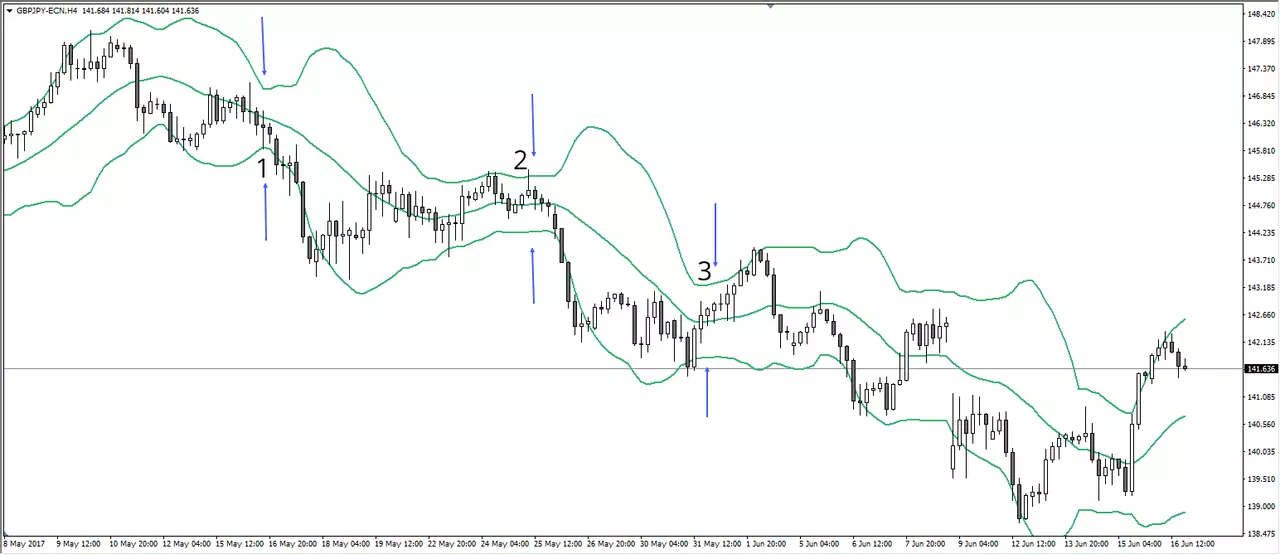
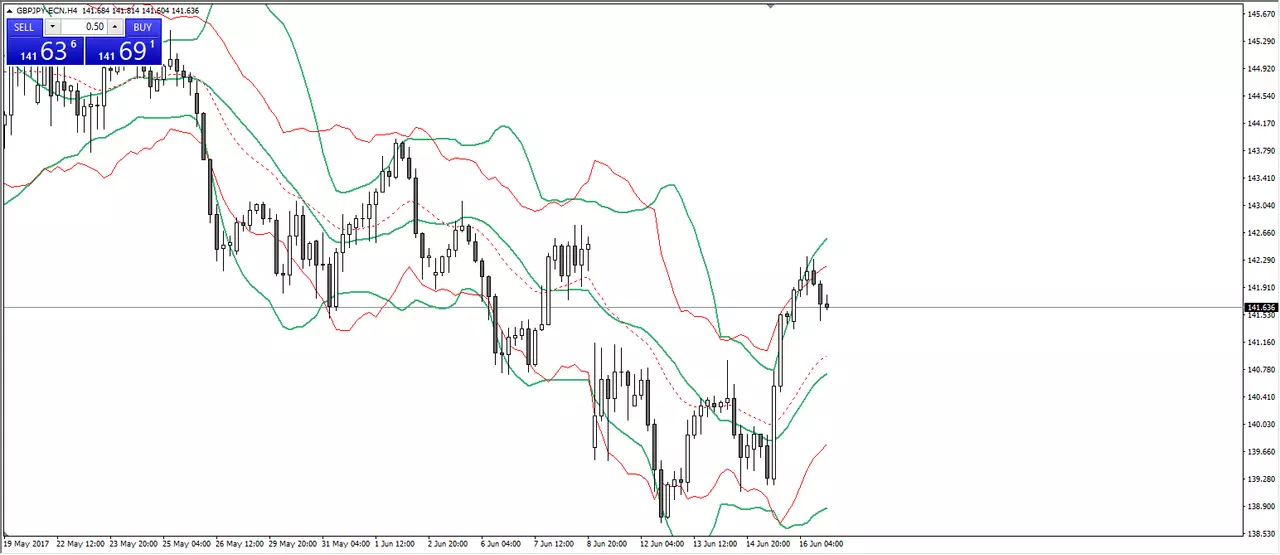
Source: Admiral Markets MT4 with MT4-SE Add-on GBP/JPY H4 chart (between May 8, 2017, to June 16, 2017). Accessed: June 16, 2017, at 20:00 GMT - Please note: Past performance is not a reliable indicator of future results, or future performance.
If we have a look at the chart above, at point 1, the blue arrow is indicating a squeeze. At point 2, it is indicating another squeeze. The same applies to point 3.
What's complicated about this situation is that we still don't know if this squeeze is a valid breakout. What we need to do is quantify how narrow the squeeze should be in order to qualify for a breakout setup of the Bollinger Bands with Admiral Keltner Breakout Strategy.
The way we do this is by adding the Admiral Keltner Channel to the chart.
Source: Admiral Markets MT4 with MT4-SE Add-on GBP/JPY H4 chart (between May 8, 2017, to June 16, 2017). Accessed: June 16, 2017, at 20:00 GMT - Please note: Past performance is not a reliable indicator of future results, or future performance.
Bollinger Bands = Green
Keltner Channel = Red
In the chart above, we have the Admiral Keltner Channel overlaid on top of what you saw in the first chart, so we can start searching for the proper squeeze. You should only trade a setup that meets the following criteria shown in the chart below.

Source: Admiral Markets MT4 with MT4-SE Add-on GBP/JPY M30 chart (between March 7, 2017, to March 10, 2017). Accessed: March 10, 2017, at 18:30 GMT - Please note: Past performance is not a reliable indicator of future results, or future performance.
- Consider taking only a Bollinger Bands with Admiral Keltner Breakout Strategy trade when both the upper and lower Bollinger Band go inside the Keltner Channel. That is the only proper way to trade this strategy.
- The yellow highlight shows examples of Bollinger Bands (green lines) going inside the Keltner Channel (red lines).
- The squeeze starts at the zones.
- When Bollinger Bands (both green lines) start to come out of the Keltner Channel (red lines), the squeeze has been released, and a move is about to take place.
- Wait for a buy or sell trade trigger.
Bollinger Bands and Keltner Channels tell you when a market is transitioning from lower to higher volatility. Using these two indicators together is stronger than using a single indicator.
Trade Trigger
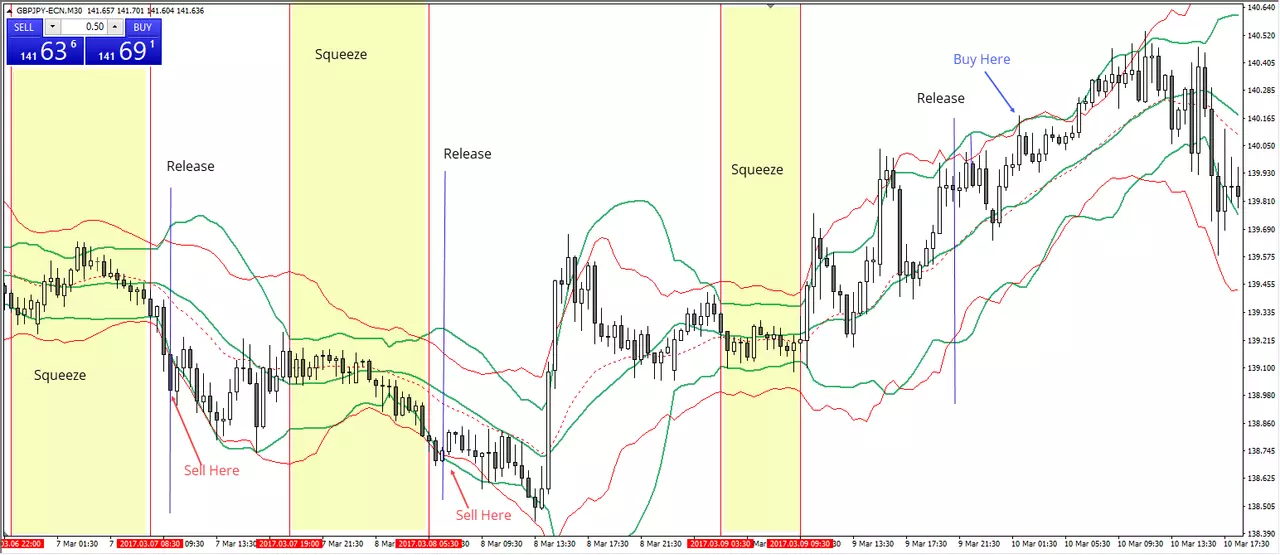
Source: Admiral Markets MT4 with MT4-SE Add-on GBP/JPY M30 chart (between March 7, 2017, to March 10, 2017). Accessed: March 10, 2017, at 18:30 GMT - Please note: Past performance is not a reliable indicator of future results, or future performance.
Buy: When a squeeze is formed, wait for the upper Bollinger Band to cross upward through the upper Keltner Channel and wait for the price to break the upper band for entry long.
Sell: When a squeeze is formed, wait for the lower Bollinger Band to cross downward through the lower Keltner Channel and wait for the price to break the lower band for entry short.
Please find another example below. After both the squeeze and release took place, we just needed to wait for the candle to break above/below the Bollinger Band and take the trade.
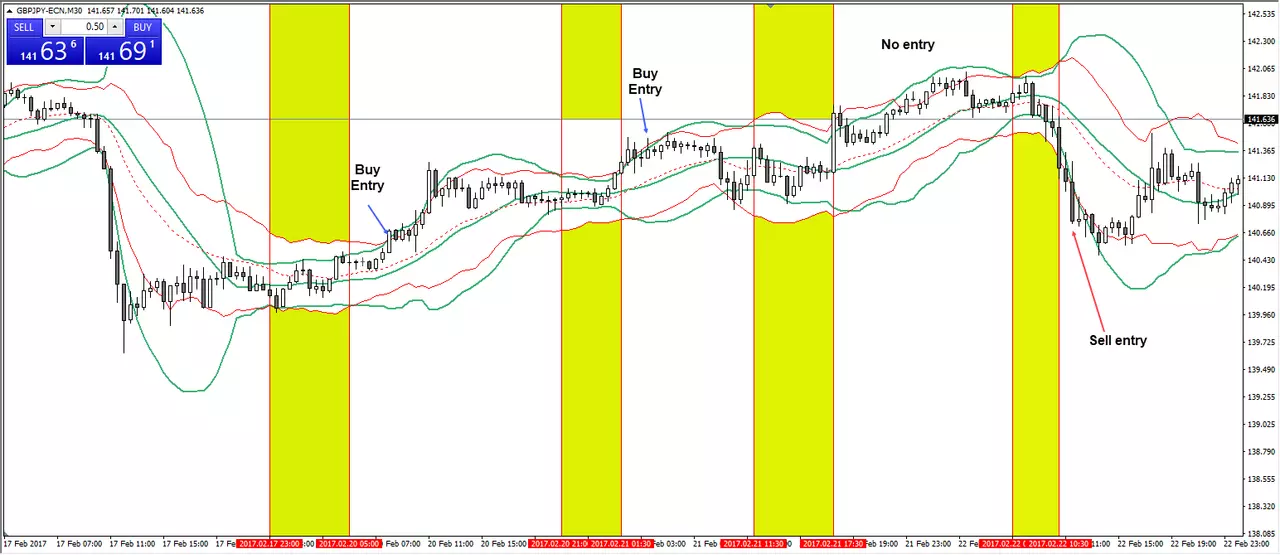
Source: Admiral Markets MT4 with MT4-SE Add-on GBP/JPY M30 chart (between February 17, 2017, to February 22, 2017). Accessed: February 23, 2017, at 00:00 GMT - Please note: Past performance is not a reliable indicator of future results, or future performance.
The example above also shows that there was no entry after the squeeze had been released as there was no candle breakout to have triggered the trade.
The recommended time frames for the strategy are the M30-D1 charts. The strategy can be applied to any instrument. Intraday breakout trading is mostly done on the M30 and H1 charts. I advise using the Admiral Pivot point for placing stop-loss and targets.
Stop-loss for buy trades is placed 5-10 pips below the middle line of the Bollinger Band or below the closest Admiral Pivot support, while the stop-loss for short trades is placed 5-10 pips above the middle line of the Bollinger Band or above the closest Admiral Pivot support.
Target levels are calculated with the Admiral Pivot indicator, available in MetaTrader Supreme Edition. For the M30-H1 chart, we use daily pivots, for the H4 and D1 charts, weekly pivots. Both settings can be changed easily in the indicator.
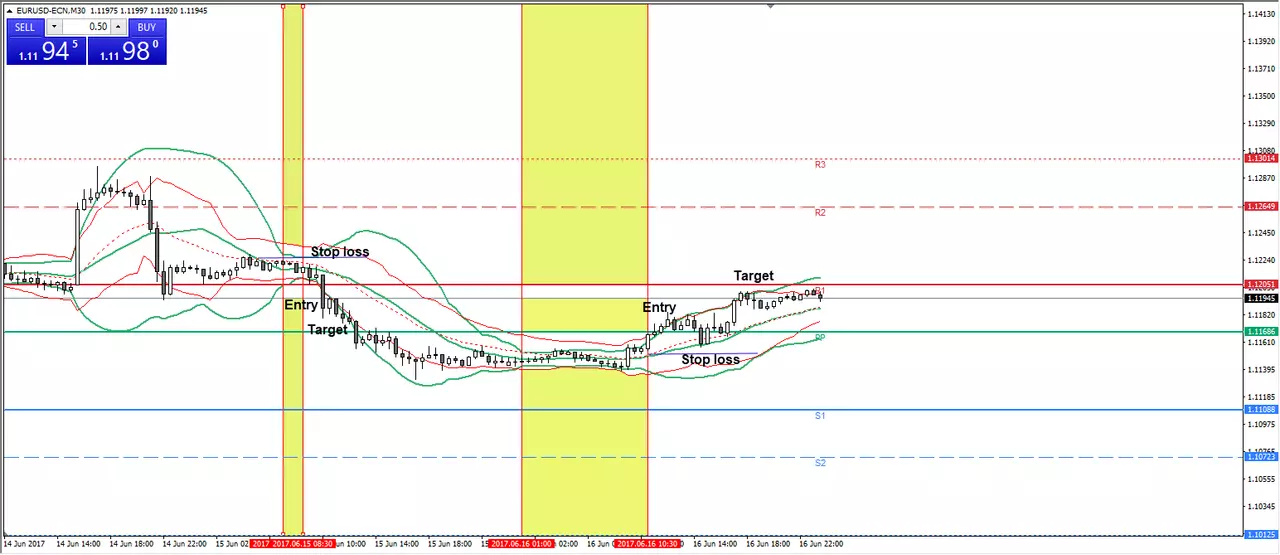
Source: Admiral Markets MT4 with MT4-SE Add-on GBP/JPY M30 chart (between February 17, 2017, to February 22, 2017). Accessed: February 23, 2017, at 00:00 GMT - Please note: Past performance is not a reliable indicator of future results, or future performance.
Pro Tips
- Tight bands will cue about big moves. Low volatility is always the calm before the storm.
- Use default settings for Bollinger Bands and the Admiral Keltner.
- Demo-trade first.
- Ride the bands, but remember that markets trend only about 20% of the time. Protect your profits with a proper risk management.
- Find a time frame that suits you best.
- Read Bollinger on Bollinger Bands. The best book has been written by the creator of the bands.
Trade With Admiral Markets
If you're feeling inspired to start trading, or this article has provided some extra insight to your existing trading knowledge, you may be pleased to know that Admiral Markets provides the ability to trade with Forex and CFDs on up to 80+ currencies, with the latest market updates and technical analysis provided for FREE! Click the banner below to open your live account today!