Retail giant Amazon beats Q2 expectations – how can we trade it?
Four of the big 5 tech companies, also known as the 'FAANG' of Facebook, Apple, Amazon and Google, reported their Q2/2020 earnings last Thursday.
All four beat expectations, even though they show a dip due to the 'Corona crisis' with Amazon clearly leading the pack, indicating that the recent and massive rally in Amazon, which saw a push higher in its stock price from its March lows to new all-time highs of more than 100%, was no fluke.
Amazon beats expectations with revenue of nearly $89 billion
For Q2/2020, Amazon reported net sales of $88.9 billion against an expected $81.24 billion and a massive Earnings per Share (EPS) of $10.30 against an expected $1.46.
When taking a deeper look and using common sense, the report of a double-digit revenue growth year over year seems not that surprising.
In fact, Amazon was caught off guard by an influx of online orders during the Coronavirus lockdown, which resulted in issues from a logistical perspective and thus helps to explain the need of creating 175,000 new jobs since March.
What certainly needs to be seen is how current developments in the global economy, such as recession fears and job uncertainties among retail customers, affect their consumer behaviour. Common sense gives us a clear answer: it will drop.
But Amazon seems well-positioned to counter such a development, e.g. thanks to its cloud-computing unit, Amazon Web Services (AWS).
While AWS reported revenues of $10.81 billion for Q2/2020, up 29% year over year, but down compared to 33% growth in Q1/2020, developments around the Corona lockdown and many companies shifting towards remote working solutions, it seems possible that AWS revenues could deliver an important revenue stream in the years to come, even though Amazon faces strong competition from Microsoft and Google.
How to trade the Amazon CFD/#AMZN in this environment?
In general, we remain clearly bullish on Amazon, even though we consider the current stock price relatively high compared to its "competition" and prefer a Long setup after a correction from a risk-reward perspective.
In regards to its stock price, we'd like to take a deeper look: when looking at the Price-Earnings ratio, Amazon has a P/E ratio of more than 150 compared to an aggregate P/E ratio in the internet retail industry of around 18 to 19.
Even though one might argue that Amazon plays in its own league, a corrective move, especially in a more volatile and risk-averse Equity environment, would also hit a giant like Amazon.
A corrective move should be expected to accelerate with a break below 2,900/30 USD with a potential target and long trigger being found around 2,450/500 USD.
In general, the mode in #AMZN should be considered bullish on a daily time-frame as long as the stock trades above its SMA(200):
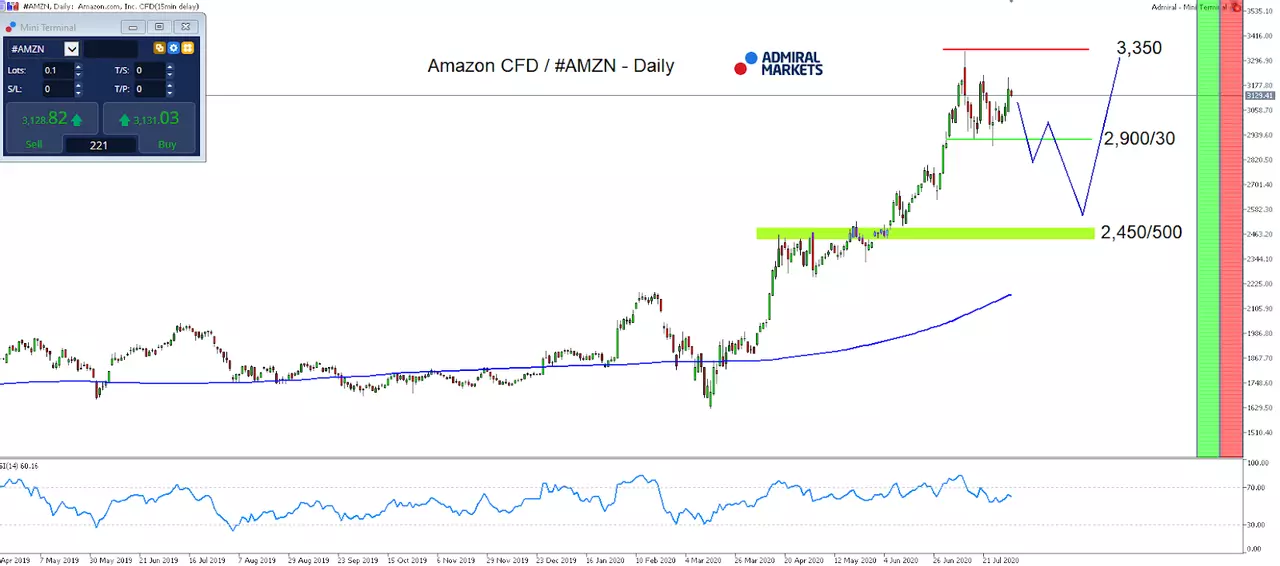
Source: Admiral Markets MT5 with MT5-SE Add-on #AMZN CFD Daily chart (between April 12, 2019, to August 3, 2020). Accessed: August 3, 2020, at 10:00pm GMT - Please note: Past performance is not a reliable indicator of future results, or future performance.
In 2015 the value of #AMZN increased by 117.78%, in 2016, it increased by 10.95%, in 2017, it increased by 55.96%, in 2018, it increased by 28.43%, in 2019, it increased by 23.03%, meaning that after five years, it was up by 495.41%.
Discover the world's #1 multi-asset platform
Admiral Markets offers professional traders the ability to trade with a custom, upgraded version of MetaTrader 5, allowing you to experience trading at a significantly higher, more rewarding level. Experience benefits such as the addition of the Market Heat Map, so you can compare various currency pairs to see which ones might be lucrative investments, access real-time trading data, and so much more. Click the banner below to start your FREE download of MT5 Supreme Edition!
Disclaimer: The given data provides additional information regarding all analysis, estimates, prognosis, forecasts or other similar assessments or information (hereinafter "Analysis") published on the website of Admiral Markets. Before making any investment decisions please pay close attention to the following:
- This is a marketing communication. The analysis is published for informative purposes only and are in no way to be construed as investment advice or recommendation. It has not been prepared in accordance with legal requirements designed to promote the independence of investment research, and that it is not subject to any prohibition on dealing ahead of the dissemination of investment research.
- Any investment decision is made by each client alone whereas Admiral Markets shall not be responsible for any loss or damage arising from any such decision, whether or not based on the Analysis.
- Each of the Analysis is prepared by an independent analyst (Jens Klatt, Professional Trader and Analyst, hereinafter "Author") based on the Author's personal estimations.
- To ensure that the interests of the clients would be protected and objectivity of the Analysis would not be damaged Admiral Markets has established relevant internal procedures for prevention and management of conflicts of interest.
- Whilst every reasonable effort is taken to ensure that all sources of the Analysis are reliable and that all information is presented, as much as possible, in an understandable, timely, precise and complete manner, Admiral Markets does not guarantee the accuracy or completeness of any information contained within the Analysis. The presented figures refer that refer to any past performance is not a reliable indicator of future results.
- The contents of the Analysis should not be construed as an express or implied promise, guarantee or implication by Admiral Markets that the client shall profit from the strategies therein or that losses in connection therewith may or shall be limited.
- Any kind of previous or modeled performance of financial instruments indicated within the Publication should not be construed as an express or implied promise, guarantee or implication by Admiral Markets for any future performance. The value of the financial instrument may both increase and decrease and the preservation of the asset value is not guaranteed.
- The projections included in the Analysis may be subject to additional fees, taxes or other charges, depending on the subject of the Publication. The price list applicable to the services provided by Admiral Markets is publicly available from the website of Admiral Markets.
.