What Is the Santa Rally?
At the end of each year, many traders and investors gear up for a unique phenomenon known as the Santa Claus Rally. In this article, we’ll look at what the Santa Rally is, explain why it happens and much more.
The information in this article is provided for educational purposes only and does not constitute financial advice. Consult a financial advisor before making investment decisions.

What Is the Santa Rally?
The Santa Rally refers to the phenomenon by which stock markets have often had a historic tendency to rally higher during the festive period.
The term was coined by Yale Hirsch in 1972 in the Stock Trader’s Almanac and, specifically, refers to the seven-day period encompassing the last five trading days of December and the first two trading days of January.
During this seven-day period, stock markets have often performed well historically.
Between 1950 and 2023, the S&P 500 reportedly gained an average of 1.3% over the course of these seven trading sessions. For reference, the index’s average seven-day return was 0.3%. It should be noted, however, that past performance is not a reliable indicator of future results.
Will There Be a Santa Rally This Year?
Of course, it’s not possible to accurately predict whether or not there will be a Santa Rally this year.
Whilst the period in question has recorded an impressive looking average gain, this does not mean it will go up during this period every year.
Indeed, we don’t have to go too far back to see an example of the Santa Rally not happening. Last year, 2024, the S&P 500 declined by around 0.5% over the seven trading sessions in question.
However, zooming out from the seven sessions which makes up the Santa Claus Rally period, the end of the year in general is often a strong period for stocks.
The chart below, created using data from stockcharts.com, shows the percentage of months over the last two decades in which the S&P 500 closed higher than it opened.
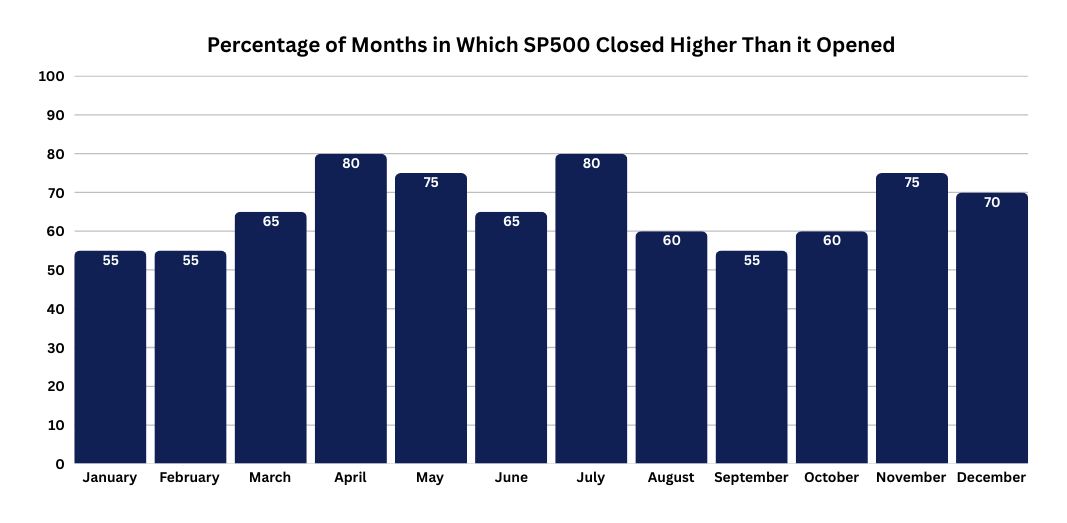
From the above chart, we can see that there is a historic tendency for stocks to rally in the final two months of the year.
Furthermore, according to research by LPL Financial, since 1950, November and December have been the S&P 500’s top two performing months in terms of average gains.
The Picture in 2025
So, how have things shaped up so far this year?
The S&P 500 edged slightly higher in November 2025, rising by 0.13%. In December, it has risen by 0.8% as of the market close on 11 December 2025.
In its latest interest rate decision, on 10 December 2025, the Federal Reserve cut interest rates by 25 basis points, as had been widely expected. This could help give US stocks a boost ahead of the festive period.
Moreover, the Bank of England (BoE) and the European Central Bank (ECB) both also have interest rate decisions slated before Christmas.
Whilst the ECB is expected to hold rates steady, the BoE is expected to cut its base rate, which could help lift UK equity markets in the build up to Christmas.
What Causes the Santa Claus Rally?
There is no clear reason as to why the Santa Rally has historically taken place. However, some of the most commonly cited reasons include:
- Tax-Loss Selling. One of the most often given reasons for the Santa Rally is that the first half of December is made up of tax-loss selling, whereby investors sell losing positions to offset their capital gains tax bill. This tends to slow down later in the month and, following this, bargain hunters might step in to buy sold-off stocks.
- Institutional Investors on Holiday. Due to the holiday season, many institutional investors are away from their desks during this period. This could result in less downward pressure from short sellers in the market.
- Lower Trading Volume: Because of trading volumes typically being lower at this time of year, an increase in buying activity has greater potential to move the market higher.
- Holiday Spirit! Another commonly cited cause is increased investor optimism due to the festive spirit! This might be exacerbated due to retail investors investing their Christmas bonuses.
- Self-Fulfilling Prophecy? Of course, it could also be the case of a self-fulfilling prophecy. If enough traders and investors believe that there is going to be a rally in the final days of December, it might lead to increased buying in the market. This could in itself spark the Santa Rally!
How to Trade the Santa Rally
As we have seen, there is historical evidence that stock markets tend to rally towards the end of the year.
Whilst past performance is not a reliable indicator of future results, any traders and investors who want to take part in a potential Santa Claus Rally can do so as follows:
- Register for a trading or investing account and complete the onboarding process.
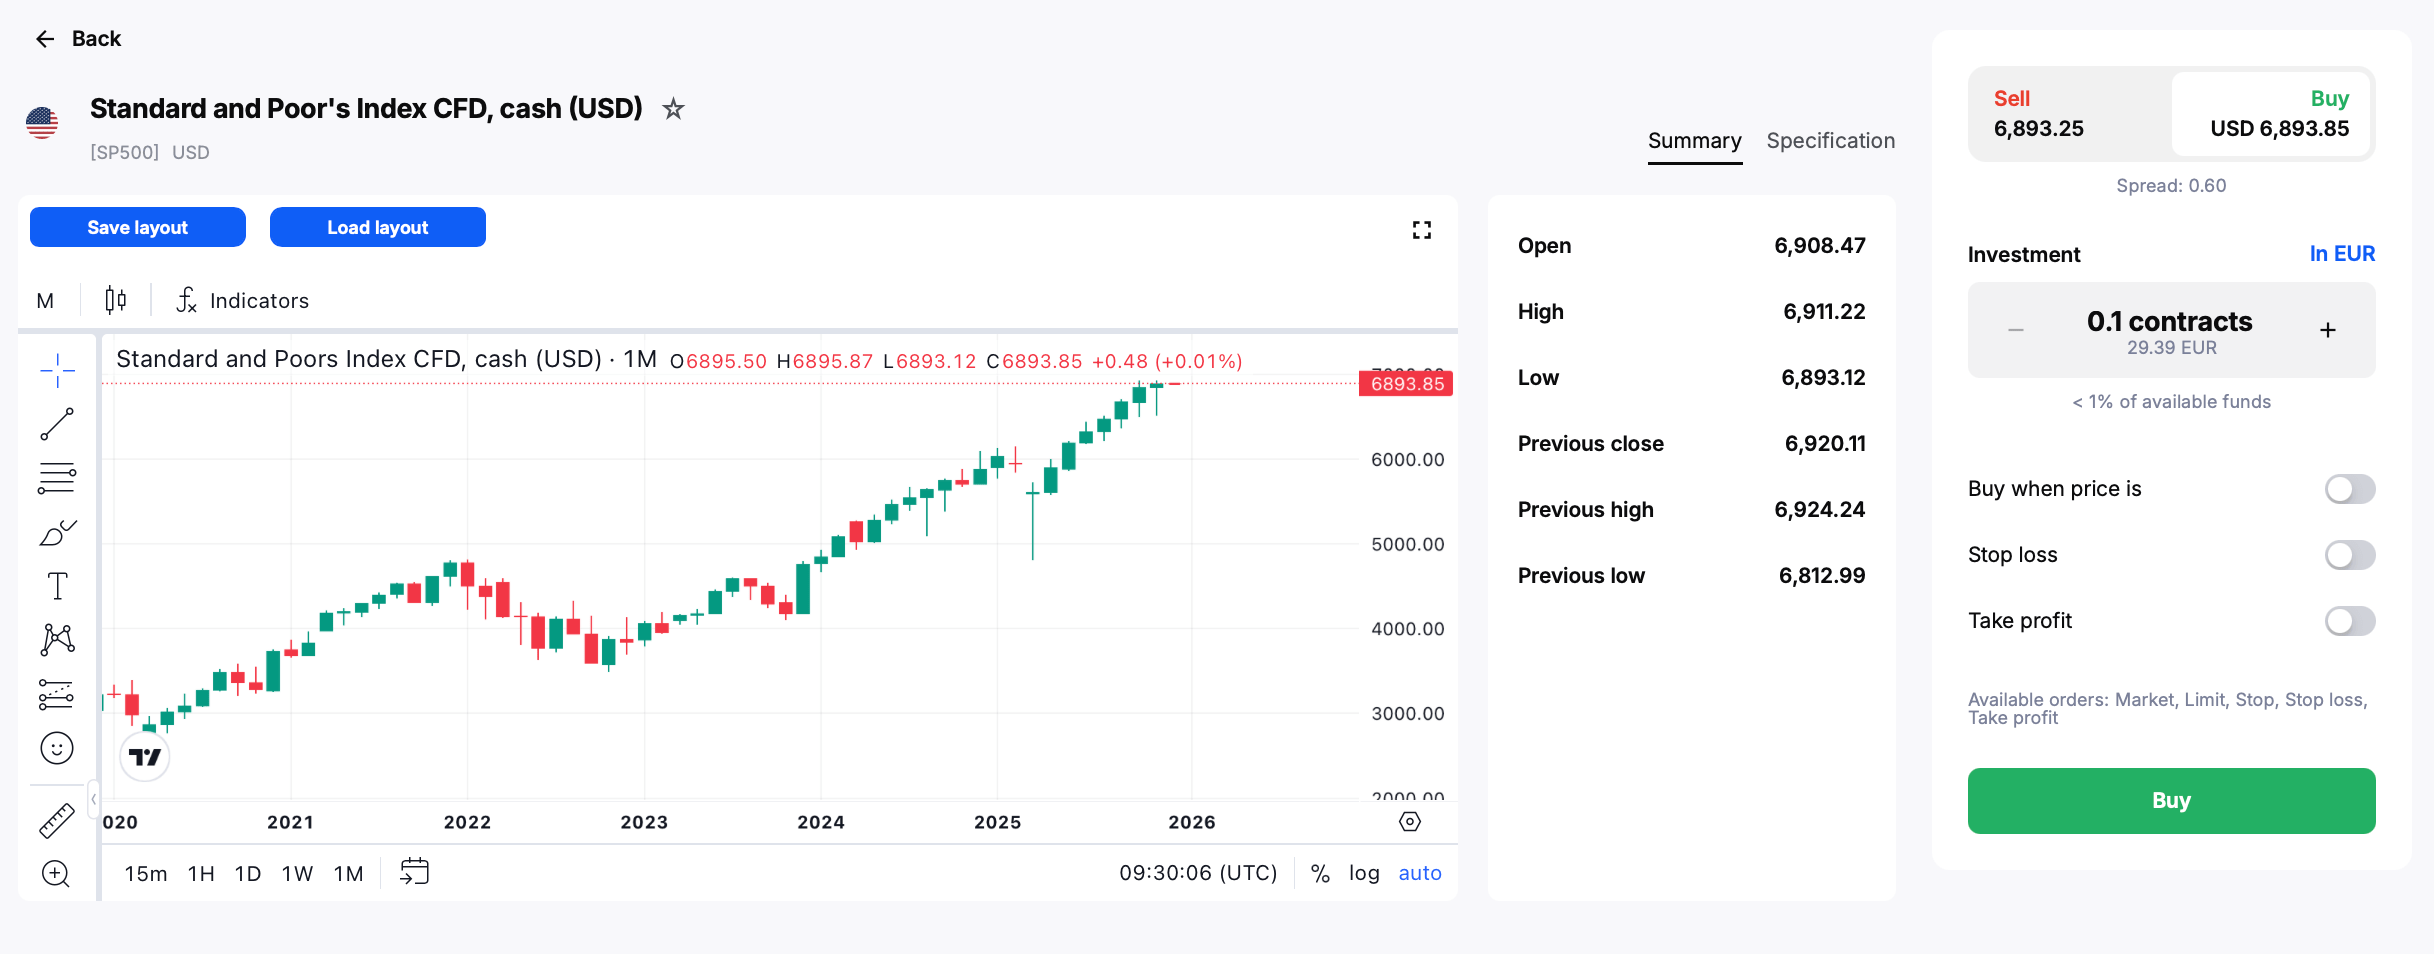
- Log in to your account and open the trading platform.
- Search for a stock or index to trade and open the instrument page.
- Create a new order and fill out the trading ticket.
Frequently Asked Questions
When does the Santa Rally start?
The Santa Rally refers to the market performance during the last five trading sessions of December and the first two sessions in January. Consequently, if it were to take place this year, the period would start on Christmas Eve, 24 December 2025.
The given data provides additional information regarding all analysis, estimates, prognosis, forecasts, market reviews, weekly outlooks or other similar assessments or information (hereinafter “Analysis”) published on the websites of Admirals investment firms operating under the Admirals trademark (hereinafter “Admirals”) Before making any investment decisions please pay close attention to the following:
- This is a marketing communication. The content is published for informative purposes only and is in no way to be construed as investment advice or recommendation. It has not been prepared in accordance with legal requirements designed to promote the independence of investment research, and that it is not subject to any prohibition on dealing ahead of the dissemination of investment research.
- Any investment decision is made by each client alone whereas Admirals shall not be responsible for any loss or damage arising from any such decision, whether or not based on the content.
- With view to protecting the interests of our clients and the objectivity of the Analysis, Admirals has established relevant internal procedures for prevention and management of conflicts of interest.
- The Analysis is prepared by an analyst (hereinafter “Author”). The Author Roberto Rivero is a contractor for Admirals. This content is a marketing communication and does not constitute independent financial research.
- Whilst every reasonable effort is taken to ensure that all sources of the content are reliable and that all information is presented, as much as possible, in an understandable, timely, precise and complete manner, Admirals does not guarantee the accuracy or completeness of any information contained within the Analysis.
- Any kind of past or modelled performance of financial instruments indicated within the content should not be construed as an express or implied promise, guarantee or implication by Admirals for any future performance. The value of the financial instrument may both increase and decrease and the preservation of the asset value is not guaranteed.
- Leveraged products (including contracts for difference) are speculative in nature and may result in losses or profit. Before you start trading, please ensure that you fully understand the risks involved.