Forex Risk Management: 10 Step Guide to Managing Risk in FX Trading
Effective forex risk management is not just an advanced trading technique; it's the foundation of protecting your capital, while trying to grow it at the same time. While many traders focus on strategies and indicators, it's typically the failure to manage risk properly that causes the biggest issues.
This guide explores the core concepts to risk management in forex, why a using a forex risk calculator is important, and ten risk management strategies to consider. This material is for informational purposes only and not financial advice. Consult a financial advisor before making investment decisions.
What is Risk Management in Forex Trading?
Risk management in forex refers to identifying, assessing, and managing the financial risks associated with currency trading and speculation. The goal for effective risk management is to try and limit losses, preserve capital, and ensure that no single trade can severely impact your overall trading account.
With high volatility and leverage available in the forex market, this is easier said than done. This is why incorporating steps into your trading plans to enact proper FX risk management is crucial. Whilst any form of speculation is inherently risky, having a risk management plan can help to manage risks over time but there is no one method or tool that eliminates them entirely.
Common Types of Risk in Forex
Here are some common types of risk in forex trading. These risks are all interconnected. Managing one of them often influences another.
| Type of Risk | Explanation |
| Market Risk | The market price moves against your position due to heightened volatility or unexpected events. |
| Leverage Risk | Using borrowed capital (leverage) to increase gains, but which also magnifies losses. |
| Interest Rate Risk | Changes in interest rates can affect currency valuations and price direction. |
| Liquidity Risk | Low liquidity may result in higher slippage or execution at worse prices. |
| Risk of Ruin | Running out of capital due to high exposure or a consecutive run of losses. |
Top 10 Forex Risk Management Strategies
Below are ten core risk management strategies to consider incorporating into a trading plan.
1. Always Use a Stop Loss
A stop loss is a predefined price level at which a losing trade will be closed automatically. It limits, but does eliminate, losses and the risk of ruin. Many traders often risk no more than 1-2% of their account per trade to also account for slippage.
2. Set Take Profit Targets
While limiting losses is important, knowing when to lock in gains is also crucial. A take-profit level closes your trade once your user-defined profit target is achieved. Many traders try and strive for a reward to risk ratio of 2:1 or more.
3. Calculate Position Size with a Forex Risk Calculator
Using a forex risk calculator allows you to determine what your exact position size should be based on your own risk tolerance level. A risk calculator prevents guesswork and emotional decision making and aligns every trade with your risk plan.
4. Only Risk What You Can Afford to Lose
Never risk more than a small, manageable portion of your account. This preserves your capital through inevitable drawdowns and allows you to continue trading while learning from experience.
5. Limit Use of Leverage
Leverage should be used cautiously. While it can increase profits, it also magnifies losses. It's important to focus on controlling the downside first before looking at potential gains.
6. Stick to a Trading Plan
Create and follow a written trading plan that includes entry and exit criteria and the risk per trade. Following a plan provides a more structured approach and reduces impulsive decisions.
7. Be Realistic with Profit Expectations
Avoid chasing unrealistic gains. Many traders fail by expecting to double their accounts quickly due to unregulated and unverified claims on social media. Focus on Aim for steady, long-term, incremental growth supported by sound risk management.
8. Diversify Your Portfolio
Spreading exposure across multiple currency pairs or asset classes can reduce correlation risk and create a more balanced portfolio.
9. Learn to Control Your Emotions
Trading is emotional. Fear and greed often influence people's decisions, leading to poor trading outcomes. Following a risk management plan can help to control emotions as it shifts the focus to a process rather than an outcome.
10. Prepare for Extreme Events
Black Swan events do occur. While you cannot predict them, you can prepare by keeping exposure small, maintaining good margin levels, exercising proper risk management and only trading with capital you can afford to lose.
Check out this video on 'Leverage, Overleverage and Position Size Calculation.' This video is for educational purposes only and does not constitute investment advice.
How to Use a Forex Risk Calculator
A forex risk calculator can be a useful addition to your risk management strategy. Brokers like Admirals, offer a Trading Risk Calculator, on their website, as shown below.
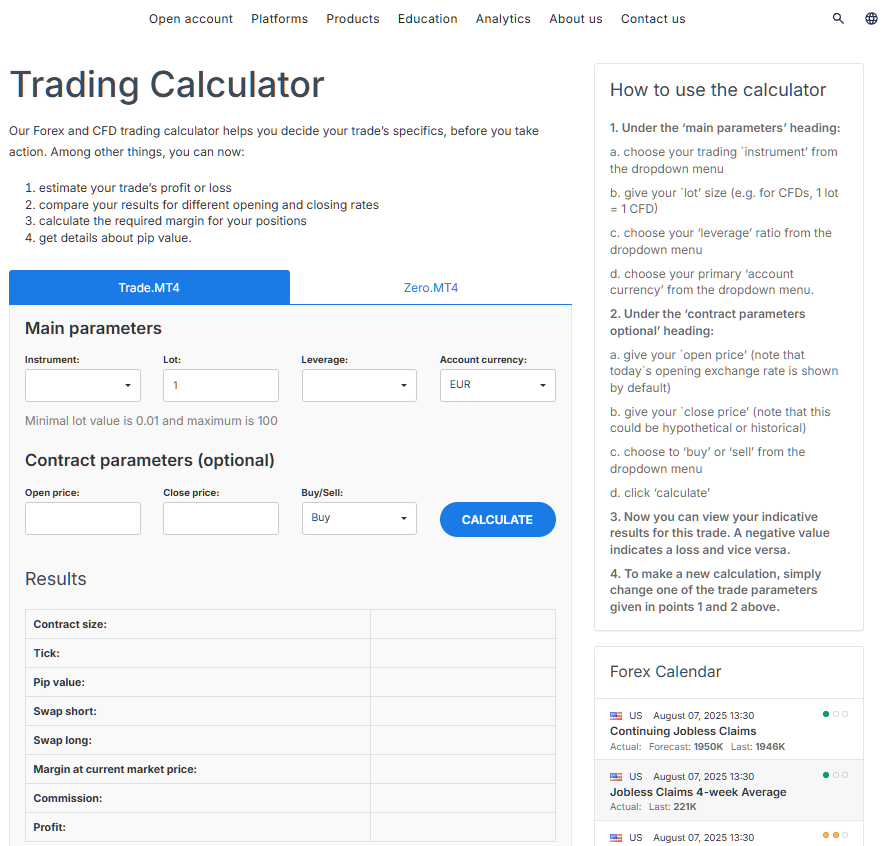
The risk calculator allows you to input your trade parameters, including:
- Instrument
- Lot
- Leverage
- Account currency
- Open price
- Close price
- Buy/Sell
The calculator will then provide the following information:
- Contract size
- Tick
- Pip value
- Swap short
- Swap long
- Margin at current market price
- Commission
- Profit
Traders can adjust the parameters, such as lot size, to then ascertain the correct level of position size for each trade. By knowing the margin requirement, potential profit and loss on a trade and any overnight swap fee charges, it can help to manage emotions more effectively before taking a trade.
Final Thoughts
Mastering forex risk management is not about avoiding risk entirely, as that is impossible. However, it is about managing risks intelligently by balancing the different risk factors on each trade.
Tools like a forex risk calculator, strategies such as stop-loss placement, analyst correlation and diversification are all helpful additions to a trading plan. Consider using a demo account to explore these tools before using real money.
Continue Reading:
- How To Become A Forex Trader
- Forex Fundamental Analysis: An Introduction
- Introduction To Forex Technical Analysis
FAQs
What is forex risk management?
It is the process of identifying the risks associated with each FX trade and having solutions on how to manage them. This could be through strategies like stop loss orders, position size calculations, identifying correlation and more.
How much should I risk per trade?
Many traders risk no more than 1-2% of their account balance per trade but it's an individual preference. What is important is to plan for an inevitable string of losing trades by keeping risk low.
What is a forex risk calculator?
A forex risk calculator is a useful tool that helps traders calculate the correct lot size for a trade based on their risk tolerance and stop loss. The Admirals Trading Risk Calculator also provides extra features like margin and overnight swap calculations.
What are common forex risk management mistakes?
Some common forex risk management mistakes include over leveraging, not using a stop loss, risking too much capital on one trade and trading emotionally without a solid plan.
Is risk management the same for all asset classes?
The principles of risk management are the same for all asset classes and strategies can overlap. However, there are some specific risks associated with each asset class and instrument that are important to plan for.
The given data provides additional information regarding all analysis, estimates, prognosis, forecasts, market reviews, weekly outlooks or other similar assessments or information (hereinafter “Analysis”) published on the websites of Admirals investment firms operating under the Admirals trademark (hereinafter “Admirals”) Before making any investment decisions please pay close attention to the following:
![Forex Demo Accounts [2026 Edition]: What They Are & How to Use Them](https://dynamic-images.admiralmarkets.com/800x,webp/fxmedia.s3.eu-west-1.amazonaws.com/featured_images/688a32f36e70a1753887475.png)