How to Read Forex Charts: A Beginner's Guide [Full Edition]
The foreign exchange (forex) market is the largest financial market in the world, trading trillions of dollars every day. For beginners, it can seem overwhelming. However, the ability to read a live forex trading chart is one of the most important skills you can develop.
This guide explains the basics of how to read forex charts, explores the main chart types, and shows how traders use candlestick patterns, OHLC and line charts, combined with different timeframes to analyse the market.
This material is for informational purposes only and not financial advice. Consult a financial advisor before making investment decisions.
What is a Forex Trading Chart?
Forex charts display historical and real-time price data, showing how currency pairs move over time. Understanding the price movement of an exchange rate is essential for spotting trends, managing risk, and making informed trading decisions.
Every forex chart, regardless of type, contains two key axes:
- Price (Vertical Axis)
- The vertical axis shows the exchange rate for the currency pair. A rising price over time indicates buyers are in control (an uptrend), while a falling price indicates sellers are in control (a downtrend).
- Time (Horizontal Axis)
- The horizontal axis represents time. Depending on the selected timeframe, each data point or “bar” on the chart could represent a minute, an hour, a day, or longer.

Exchange Rate Movement and Pips
Price changes in forex pairs are measured in pips (percentage in points). For most currency pairs, one pip is the fourth decimal place (0.0001), while for Japanese yen pairs, it is the second decimal place (0.01).
For example:
- EUR/USD moves from 1.1338 to 1.1289 → a change of 0.0049 = 49 pips.
3 Types of Forex Trading Charts
In this section, we will cover the three types of forex charts, the basic elements of reading a chart, before moving to some advanced chart reading in the next section.
1. Line Charts
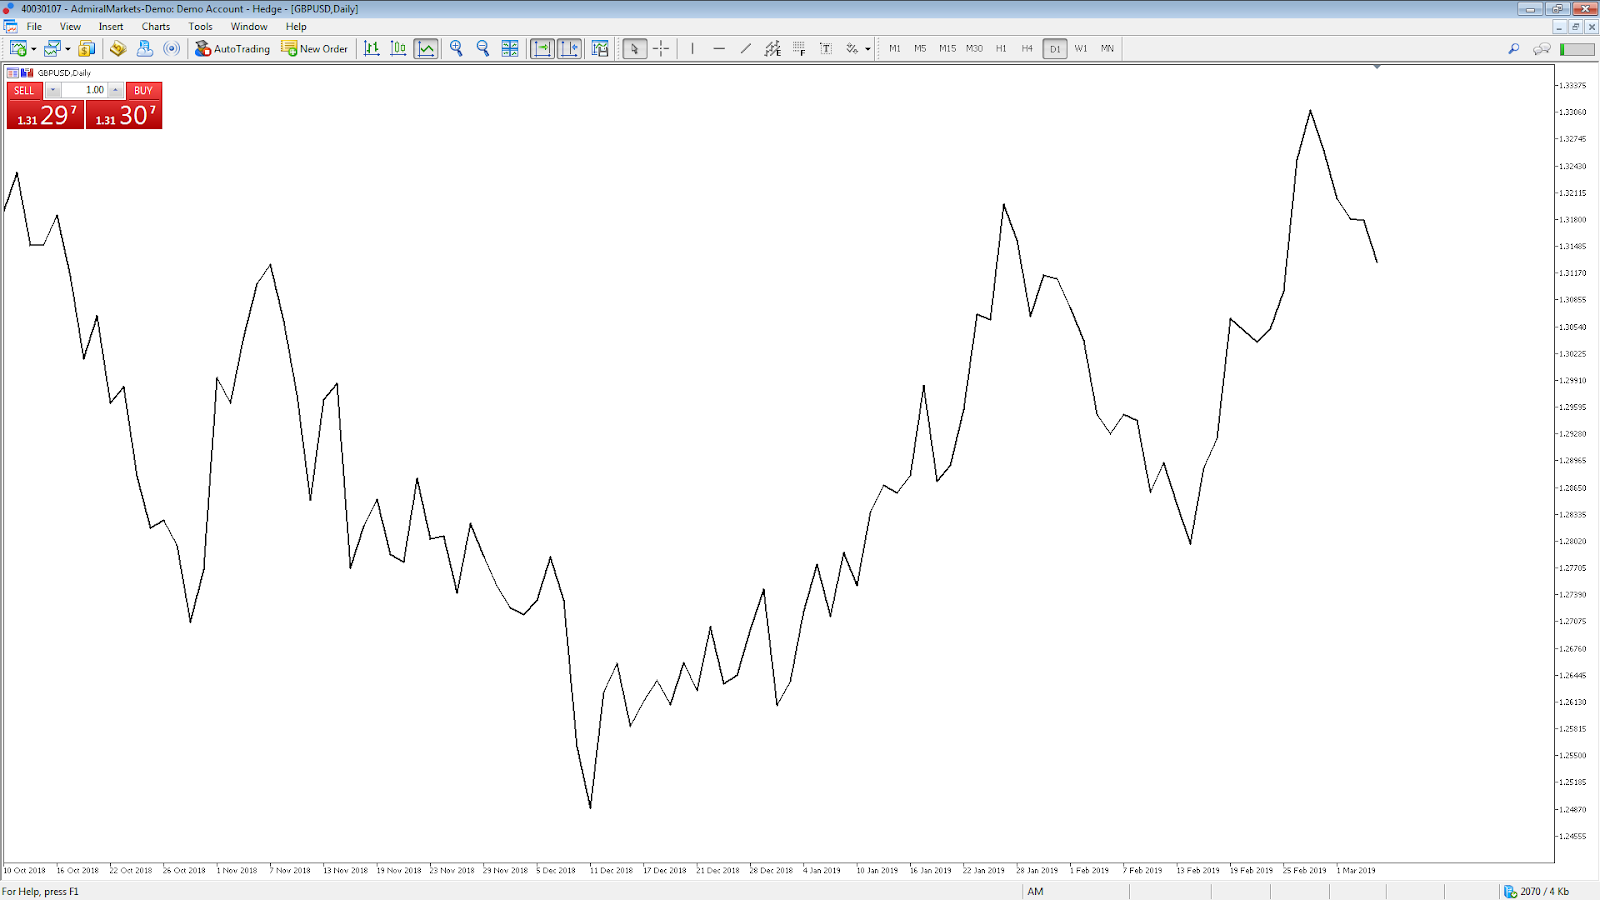
A line chart connects the closing prices of the timeframe you are viewing. So, when viewing a daily chart the line connects the closing price of each trading day. This is the most basic type of chart used by traders. If you are using a Forex daily chart trading system with a line chart, you will mainly be able to identify bigger picture trends. Line charts do not offer much else, unlike some of the other chart types.
2. OHLC Bar Charts
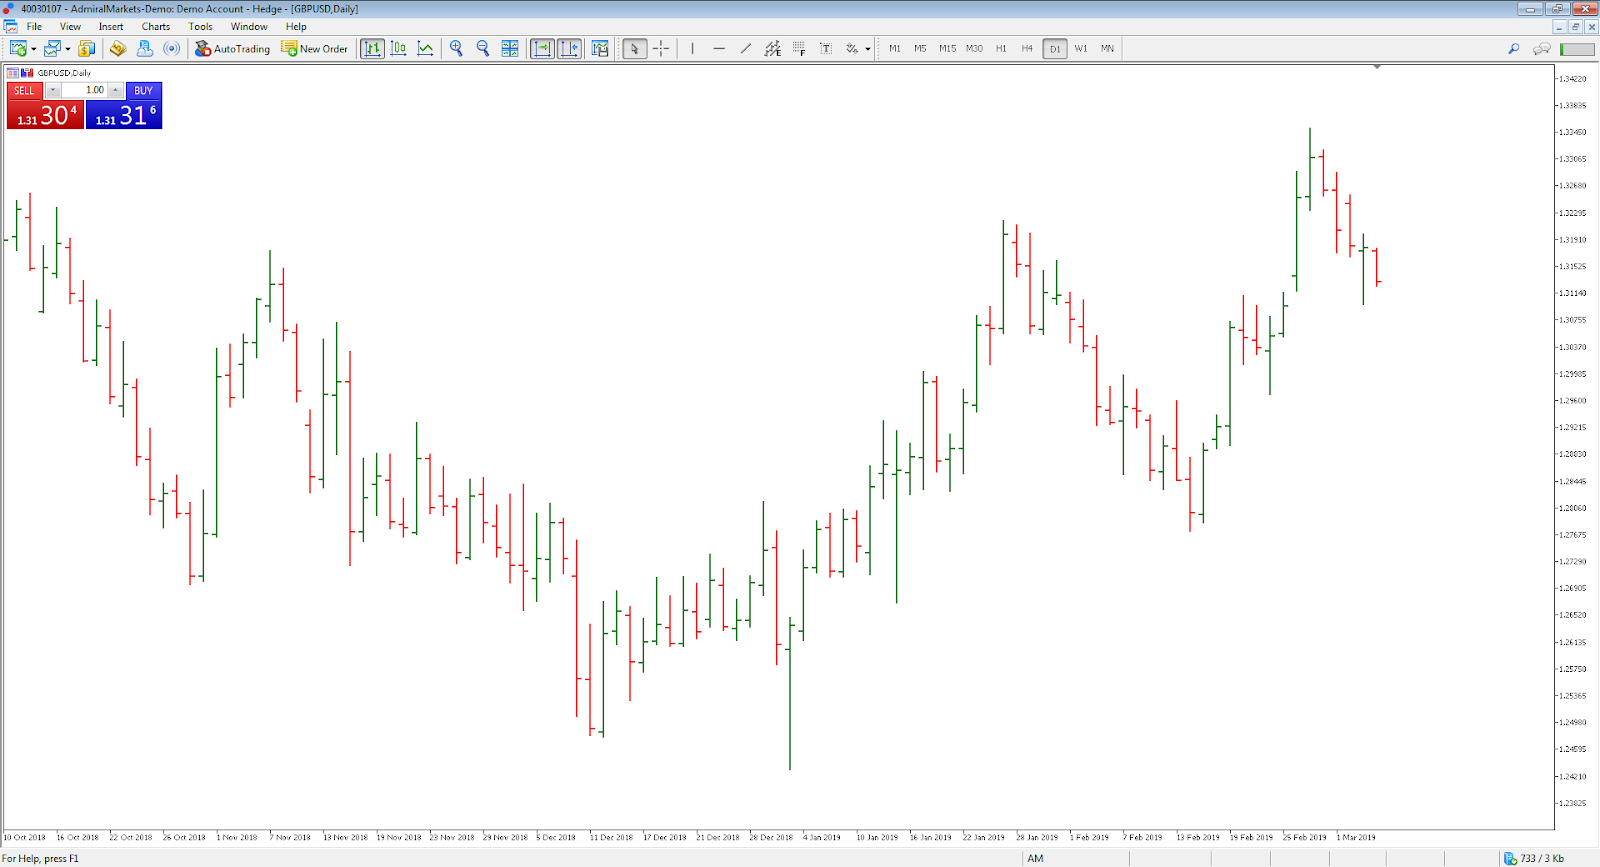
An OHLC bar chart shows a bar for each time period the trader is viewing. So, when looking at a daily chart, each vertical bar represents one day's worth of trading. The bar chart is unique as it offers much more than the line chart such as the open, high, low and close (OHLC) values of the bar.
The dash on the left represents the opening price and the dash on the right represents the closing price. The high of the bar is the highest price the market traded during the time period selected. The low of the bar is the lowest price the market traded during the time period selected.
- The green bars are known as buyer bars as the closing price is above the opening price.
- The red bars are known as seller bars as the closing price is below the opening price.
In either case, the OHLC bar charts help traders identify who is in control of the market - buyers or sellers. These bars form the basis of the next chart type called candlestick charts.
3. Candlestick Charts

Candlestick charts were first used by Japanese rice traders in the 18th century. They are similar to OHLC bars in the fact that they also give the open, high, low and close values of a specific time period. However, candlestick charts have a box between the open and close price values. This is also known as the 'body' of the candlestick.
Many traders find candlestick charts the most visually appealing when viewing live forex charts. They are also very popular as they provide a variety of price action patterns used by traders all over the world, which we discuss in more detail in the next section.
Forex Chart Timeframes
When viewing live forex charts, there are multiple timeframes you can use. Typically, there is no top time chart for Forex trading. The time frame chosen by a trader will depend on their overall style, for example:
- The monthly, weekly and daily forex charts, tend to suit traders who hold positions for long periods of time or use swing trading or positional trading styles.
- The four-hour, hourly and thirty-minute forex charts, tend to suit traders who like to trade intraday and hold positions for a few hours to a few days.
- The 15-minute, five-minute and one-minute forex charts, tend to suit traders who hold positions for very short periods of time such as day traders and scalpers.
How to Read Forex Candlestick Charts
Below is an example of the two most basic types of candlestick formations: the buyer candle and the seller candle.

Both candles give useful information to a trader:
- The high and low price levels tell us the highest price and the lowest price made within the timeframe selected.
- The seller candle, shown by a red or sometimes black body, tells us that sellers won the battle during the selected time period. This is because the closing price level is lower than the opening price level.
- The buyer candle, shown by a green, or sometimes white body, tells us that buyers won the battle during the selected time period. This is because the closing price level is higher than the opening price level.
How would traders use this information? There are many different ways, but in general, a few theoretical options could include:
- If after the seller candle, the next candle goes on to make a new low, then it is a sign that sellers are willing to keep on selling the market. This weakness will cause some traders to initiate short (sell) positions, or hold on to the short positions they already have.
- If after the buyer candle, the next candle goes on to make a new high then it is a sign that buyers are willing to keep on buying the market. This strength will cause some traders to initiate long (buy) positions, or hold on to the long positions they already have.
The usefulness of candlestick charts does not stop there. When learning how to read candlestick charts, it is also worthwhile looking at some of the major types of unique patterns they make, as they help traders in their decision-making process.
Bullish Candlestick Chart Patterns
Here are just a few examples of bullish candlesticks:
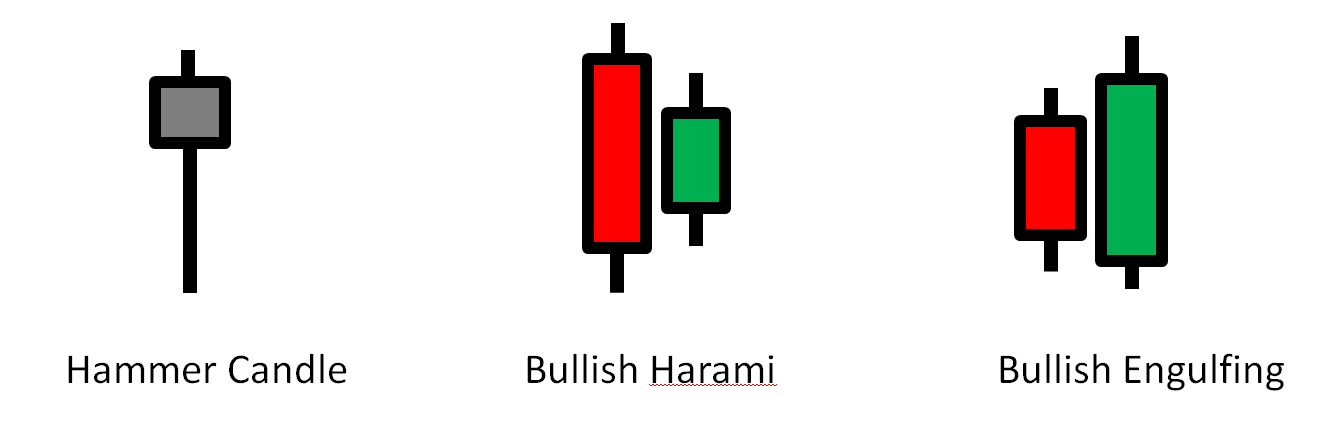
The hammer candle shows sellers pushing the market to a new low and then the buyers pushing it all the way back up. With the open and close price levels in the upper half of the candle, it represents a rejection of the downside and possible strength to the upside in the future.
The bullish harami is a red candle followed by a green candle pattern which represents indecision in the market and the possibility of a breakout from it. These are also called 'inside candle' formations as one candle forms inside the previous candle's high to low price range.
The bullish engulfing is a red candle followed by a green candle pattern which represents a strong shift in sentiment in the market. Essentially, a candle totally engulfs the previous candle's high to low price range, suggesting a continuation to the upside is likely.
Bearish Candlestick Chart Patterns
Here are just a few examples of bearish candlesticks:
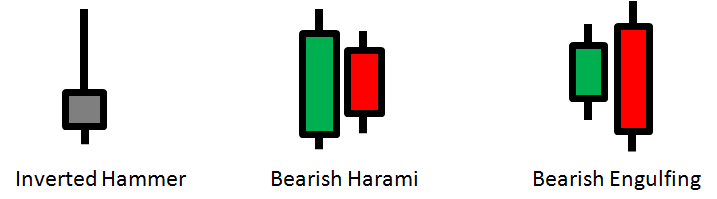
The inverted hammer, also known as a shooting star, candle shows buyers pushing the market to a new high and then the sellers pushing it all the way back down. With the open and close price levels in the lower half of the candle, it represents a rejection of the upside and a possible move to the downside next.
The bearish harami is a green candle followed by a red candle pattern which represents indecision in the market and the possibility of a breakout from it. These are also called 'inside candle' formations as one candle forms inside the previous candle's high to low price range.
The bearish engulfing is a green candle followed by a red candle pattern which represents a strong shift in sentiment in the market. Essentially, a candle totally engulfs the previous candle's high to low price range suggesting a continuation to the downside is likely.
Identifying Forex Trading Patterns on Candlestick Charts
Now you know more about how to read candlestick charts, can you spot any candlestick patterns below?

These are just some of the patterns you can typically find on candlestick charts. It doesn't highlight all of them but is a foundation to build upon. Identifying market cycles can be useful when analysing forex trading charts, as they can help determine the overall trend or future directional bias of a market. Of course, it doesn't tell us how many pips the market will move by but can help form part of the picture when reading forex charts.
Learn how to analyse market structure and patterns in this video. This video is for educational purposes only and does not constitute investment advice.
Final Thoughts
Learning how to read forex charts is an essential component of trading the financial markets. Here are three steps to consider to help you practice your chart-reading skills.
- Open a demo account to practice in a virtual environment.
- Train yourself in identifying trends and chart patterns.
- Keep a trading journal to track what you see and how the market reacts.
FAQs
How to read forex charts for beginners?
The horizontal axis represents time, while the vertical axis shows the exchange rate price. A line chart will show you how price has moved up and down in the past. An OHLC chart will show the values of the open, close, high and low of each time period. Candlestick forex charts have a box, or body, in between the open and close of an OHLC chart.
How to master forex charts?
Open a demo trading account to practice in a virtual environment. Train yourself to recognise chart patterns, candlestick patterns and trends that develop over time. Track these learnings in a journal and see how the market responded after.
The given data provides additional information regarding all analysis, estimates, prognosis, forecasts, market reviews, weekly outlooks or other similar assessments or information (hereinafter “Analysis”) published on the websites of Admirals investment firms operating under the Admirals trademark (hereinafter “Admirals”) Before making any investment decisions please pay close attention to the following:
- This is a marketing communication. The content is published for informative purposes only and is in no way to be construed as investment advice or recommendation. It has not been prepared in accordance with legal requirements designed to promote the independence of investment research, and that it is not subject to any prohibition on dealing ahead of the dissemination of investment research.
- Any investment decision is made by each client alone whereas Admirals shall not be responsible for any loss or damage arising from any such decision, whether or not based on the content.
- With view to protecting the interests of our clients and the objectivity of the Analysis, Admirals has established relevant internal procedures for prevention and management of conflicts of interest.
- The Analysis is prepared by an analyst (hereinafter “Author”). The Author Jitanchandra Solanki is an employee for Admirals. This content is a marketing communication and does not constitute independent financial research.
- Whilst every reasonable effort is taken to ensure that all sources of the content are reliable and that all information is presented, as much as possible, in an understandable, timely, precise and complete manner, Admirals does not guarantee the accuracy or completeness of any information contained within the Analysis.
- Any kind of past or modelled performance of financial instruments indicated within the content should not be construed as an express or implied promise, guarantee or implication by Admirals for any future performance. The value of the financial instrument may both increase and decrease and the preservation of the asset value is not guaranteed.
- Leveraged products (including contracts for difference) are speculative in nature and may result in losses or profit. Before you start trading, please ensure that you fully understand the risks involved.
![Learn How to Trade: A Practical Guide for Beginners [Full Edition]](https://dynamic-images.admiralmarkets.com/800x,webp/fxmedia.s3.eu-west-1.amazonaws.com/featured_images/689ef1cc0ef121755247052.png)