Why the Keltner Band Indicator Is More Valuable Than Bollinger Bands ®
Do you have a favourite tool or indicator for analysing the charts or entering a trade?
This is true for most traders, including myself, which is why this article will explain one of my most treasured indicators: the Keltner Band.
Prepare yourself for a 360 degree view on the Keltner, including its main benefits as a support and resistance tool and how I use the indicator for potential entry points.
First of all, let's discuss a core question first of all: what is the Keltner Band?
What Is the Keltner Band?
The Keltner Band, or Keltner Channel, is part of the technical analysis family and it indicates a support and resistance (S&R) level around a moving average (exponential moving average).
The S&R levels are volatility based and calculated by using the Average True Range (ATR). Chester W. Keltner (1909-1998) invented the indicator and mentioned it for the first time in this book named "How to Make Money in Commodities".
Tip: check out the article on the Keltner channel indicator for more details.
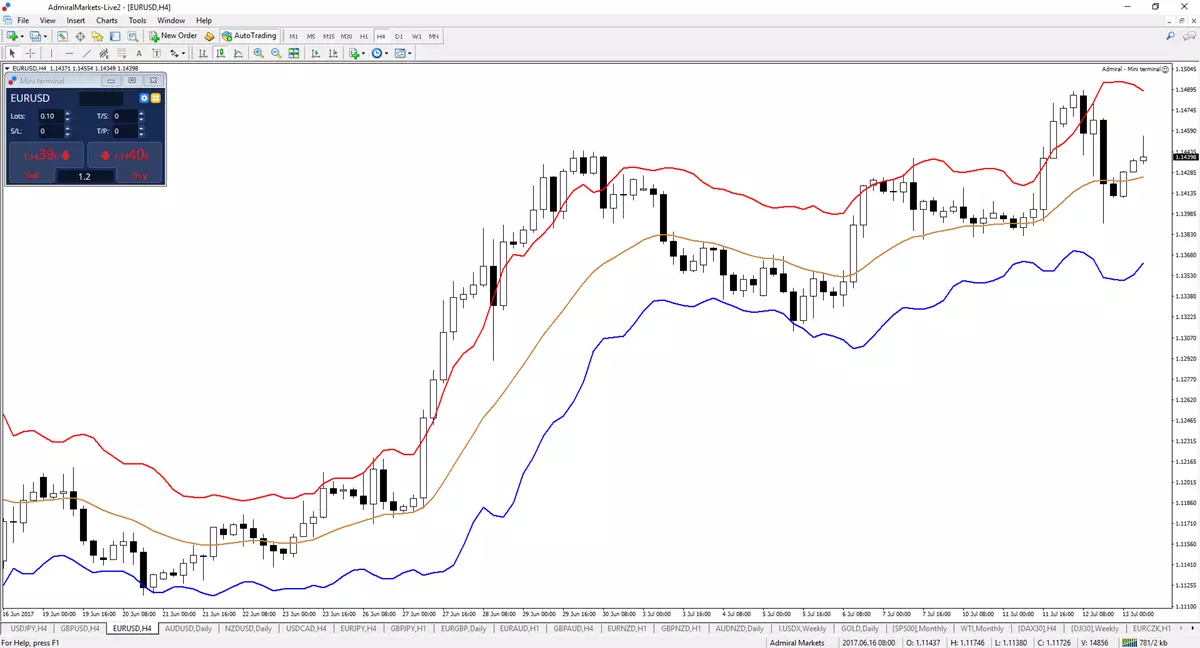
Source: EUR/USD 4 hour chart from 16 June to 13 July 2017 showing Keltner Band which consists of 3 levels: support (blue), resistance (red) and moving average (brown).
What's the Difference Between Keltner and Bollinger Bands?
Before we dive into the difference, let's start with the similarities and benefits of using Keltner or Bollinger Bands (BB):
- Keltner is an indicator that is automated and will update without any manual work from the trader.
- It works well on most of the financial instruments and time frames (at least the ones that I regularly review in the live trading webinars).
- The Keltner indicator is a great tool for spotting support (the blue line in image the above) and resistance levels (the red line in the image above).
- The indicator helps me identify potential reversal and breakout trade setups.
Basically, the Keltner indicator and Bollinger Bands are similar as both are volatility-based channels. The main difference between the two indicators is that a different volatility indicator is used behind the math:
- Keltner: the Average True Range (ATR) is the deciding indicator when calculating the volatility for the Keltner indicator.
- Bollinger: standard deviation is the main factor when calculating the volatility for the Bollinger Bands (BB).
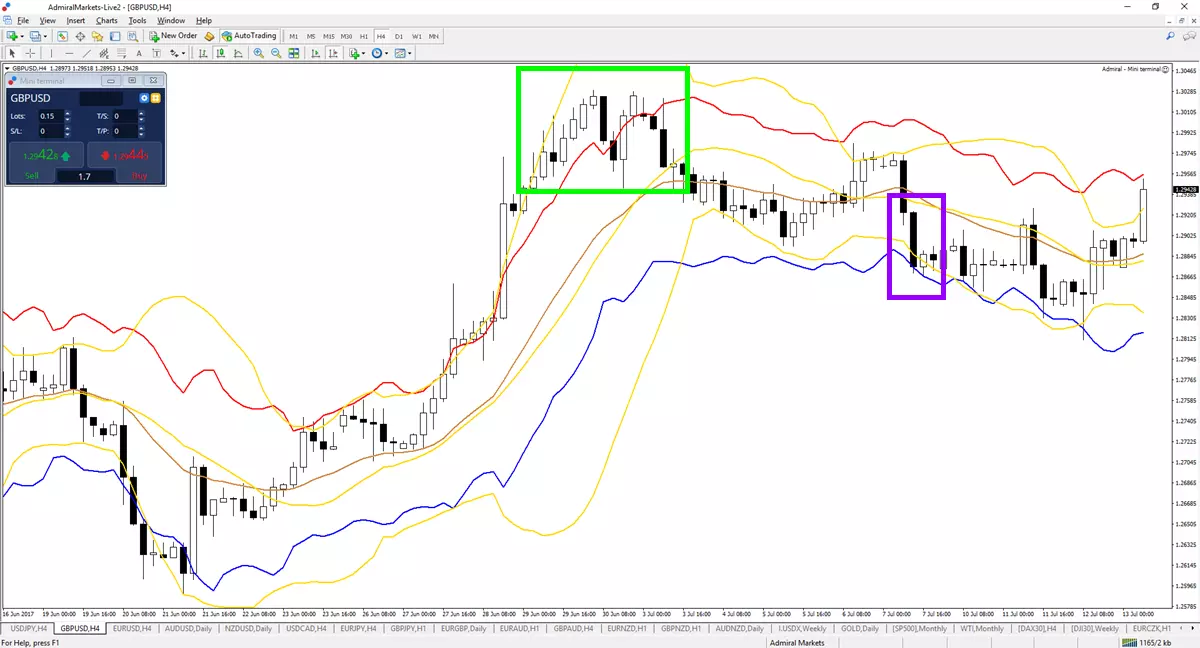
Source: GBP/USD 4 hour chart from 16 June to 13 July 2017 showing both the Bollinger Bands and the Keltner Indicator
Why Do I Prefer Keltner Over Bollinger Bands?
Personally, I prefer the Keltner indicator because it responds more calmly when price movements excellerate. You can see the difference when viewing the chart above:
- The BB expands widely as price starts to move with more momentum.
- The Keltner Channel offers a clear bounce or breakout spot (more information in the next paragraph).
BB expansion: the Keltner bands, however, also react to the increased volatility but not with the same intensity. Therefore, price eventually returns back into the Keltner bands more quickly, which provides information about the end of the momentum (green box).
S&R levels: the Keltner Channel offers a better bounce or breakout spot. As you can see in the image above, at times BB levels shrink very closely to price, which can provide occasional false breakouts (purple box). In my view, Keltner provides a more stable S&R indicator because it does not react as closely to volatility as the BB.
The normal MetaTrader 4 platform does not offer the Keltner Channels, but there is some good news… The MetaTrader 4 Supreme Edition offers the Keltner indicator as a special add-on, together with 60 other extra features. Besides the Admiral Keltner indicator, you definitely want to check out the other tools, indicators and other useful 'gadgets'. Check the video below for more info on Keltner.
Trading the Breakout or Bounce With Keltner
The Admiral Keltner indicator provides key support and resistance levels because the channel lines are considered to be an extreme. When price action arrives at the outer edge of the channel, price will have the choice to either break or bounce.
From my trading observations, I notice that the direction price chooses typically indicates a decent probability of continuation. What I mean is this: reversal signals will often lead to a reversal and breakout signals will see breakouts.
Here is a step-by-step guide to how I approach analysing the chart and trading setups with the Admiral Keltner indicator:
Step 1: Analysis
My first step is to analyse the markets by reviewing the entire market structure of the financial instrument, regardless of its type – Forex, CFD, or a commodity. When analysing the chart, I use trend, momentum, patterns and support and resistance on multiple time frames to understand the bigger picture.
Step 2: Decision Zone
Once my analysis is completed, I will know whether I am interested in trading the financial instrument as well. Once I am interested in a potential setup, Admiral Keltner will help out with trading the potential decision zone via either a breakout or bounce trade setup. Why? Because price action has reached an extreme and the support and resistance levels of the Keltner band are going to act as key 'decision zones' where price will either break or bounce .
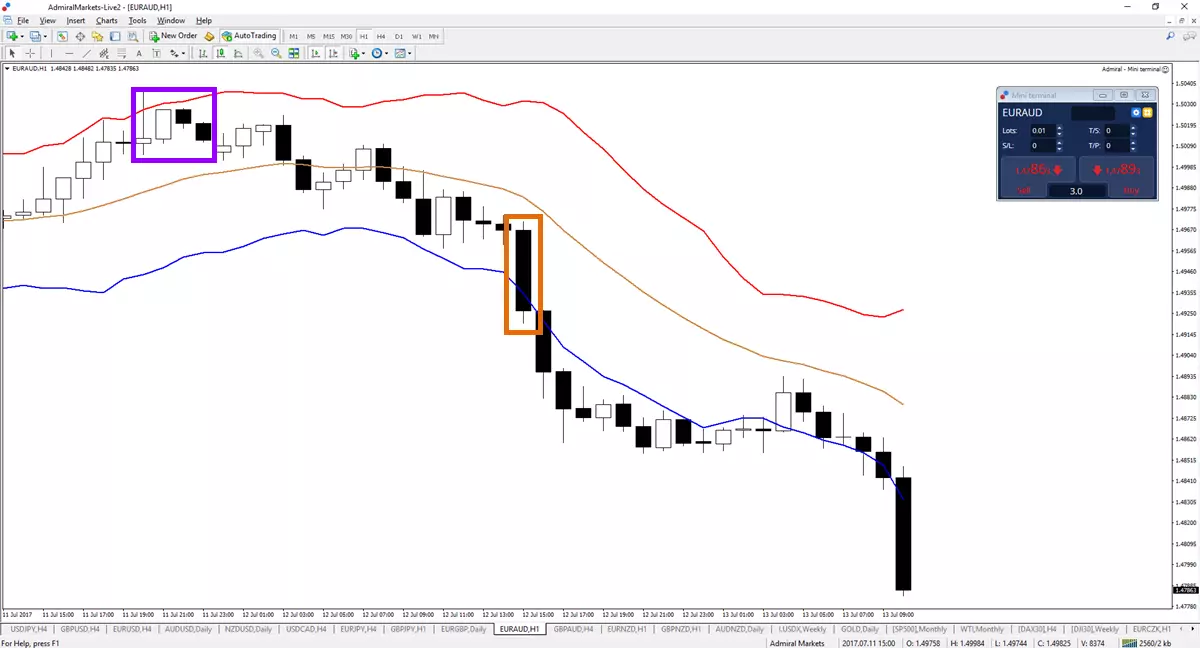
Source: EUR/AUD 1 hour chart from 11 July to 13 July 2017
Step 3: Breakout or Bounce
Trading the bullish or bearish breakout or bounce setup can be done by using the support and resistance levels of the Admiral Keltner channel. I use candlesticks and candlestick patterns to monitor the candle reaction to Admiral Keltner. Here is how:
- A bullish breakout of Admiral Keltner resistance: the candlestick closes near high or a bullish candlestick pattern is visible.
- A bearish breakout of Admiral Keltner support: the candlestick closes near low or a bearish candlestick pattern is visible (see the orange box in the image above).
- A bullish bounce at Admiral Keltner support: the candlestick closes near high or a bullish candlestick pattern is visible.
- A bearish bounce at Admiral Keltner resistance: candlestick closes near low or a bearish candlestick pattern is visible (see the purple box in the image above).
Price action is the final confirmation and shows me whether the real path of the market, not something I hope or wish the market will do.
Remember, as traders we want to follow the price action and let the markets lead. Not the otherway around.
Waiting for candlestick reactions and patterns with Admiral Keltner bands provides me an excellent guideline of what to expect and when.
Warning Signals When Trading With Keltner
Last, but not least, here's a heads-up. Yes, Admiral Keltner is a great indicator but it does not replace the need for a proper trading plan, serious management and mental awareness. Here a a few warnings before using Admiral Keltner on the chart:
- The Admiral Keltner indicator is valid on all of the time frames and instruments that I regularly check and analyse, but you want to check your own instruments before using the indicator.
- The Keltner indicator is not a standalone strategy. There are other tools, indicators and concepts needed to trade consistently and (hopefully) profitably.
- Always practise with a demo account first to see if the indicator helps your trading or not. Then trade with a very small risk before applying the indicator on more serious trades.
- Last, but not least, always apply proper risk management, money management, and trade management to the trade setup.
For more examples on trading the market with the Keltner indicator, please check out the video below.
For more articles, webinars, and information on trading, make sure you visit the Analytics and Education sections of our website.
Also, feel free to test Admiral Markets' MetaTrader 4 Supreme Edition – a special plug-in with 60+ extra features to tackle the markets including a package of extra indicators. Click the banner below to download:
<a href="https://admiralmarkets.com/trading-platforms/metatrader-se"><img src="https://fxmedia.s3.amazonaws.com/articles/MT4_Supreme_Edition_CTA_2-5.png" style="" alt="Trade With MetaTrader 4 Supreme Edition" rel=""></a>