How to Trade Shell's 20% Surge Amid Oil & Gas Boom
During the pandemic the share price of many energy companies cratered to 30-year lows. For example, the Royal Dutch Shell share price crashed more than 50% to lows not seen since 1995.
However, as economies reopen from the pandemic the need for energy products such as oil and gas has risen exponentially.
The Royal Dutch Shell share price is now up more than 100% from those lows. With analysts turning increasingly bullish on the energy sector amid the recent oil and gas boom, it is now an interesting time for the Shell share price UK.
| Stock: | Royal Dutch Shell PLC (Class B) |
| Exchange: | LSE |
| Symbol for Invest.MT5 Account: | RDSB.UK |
| Date of Idea: | 11 January 2022 |
| Time Line: | 1 - 12 months |
| Entry Level: | GBX 1,764.00 |
| Target Level: | GBX 2,101.43 |
| Position Size for Invest.MT5 Account: | Max 7% |
| Risk: | High |
- The Invest.MT5 account allows you to buy real stocks and shares from 15 of the largest stock exchanges in the world.
All trading is high risk and you can lose more than you risk on a trade. Never invest more than you can afford to lose as some trades will lose and some trades will win. Start small to understand your own risk tolerance levels or practice on a demo account first to build your knowledge before investing.

Why Trade the Royal Dutch Shell Share Price?
Royal Dutch Shell (RDSB) has one of the world’s largest energy operations. Business suffered during the pandemic period as economies ground to a halt. Now that economies are reopening and growing once more the demand for energy has already increased to pre-pandemic levels.
This increase in demand can often help energy companies. In particular, some European energy companies which – compared to US energy companies – are undervalued from a price to earnings perspective.
For example, at the time of writing the Royal Dutch Shell price is trading at seven times its projected 2022 earnings compared to Exxon Mobil which is trading at a multiple of 11.
Reason 1: Demand for oil and gas is likely to increase, while supply remains limited
According to analysts from Deutsche Bank, the oil and gas sectors are set for a positive year in 2022. In fact, most analysts are forecasting higher prices of oil and gas due to an increase in demand and issues with supply. It usually takes around a decade to build new meaningful reserves of oil. While Iran could help to lift the supply levels of oil, analysts at Schroders believe supply will still remain limited.
This is due to the fact, OPEC+ (the Organization of Petroleum and Exporting Countries and ten additional countries including Russia) may only return to average production levels before the pandemic which would lead the world 2.3 million barrels per day short of the forecasted demand which could lead to higher oil prices.
With demand set to increase and supply remaining limited, the higher price in oil is likely to help the profit margins of oil stocks such as Royal Dutch Shell.
Reason 2: Institutional demand and stock buybacks could help the Royal Dutch Shell share price
At the beginning of this year, Shell announced that it will be carrying out share buybacks at ‘pace.’ Its $7 billion share buyback programme comes mainly from the sale of its U.S. shale business. Share buybacks return wealth to its shareholders by the company using its cash reserves to buy back its shares from the marketplace.
Institutional demand for the Royal Dutch Shell A (RDS.A) stock listed in the U.S. has been increasing every quarter since the end of 2020 – according to the SEC (Securities and Exchange Commission) 13F filing reports.
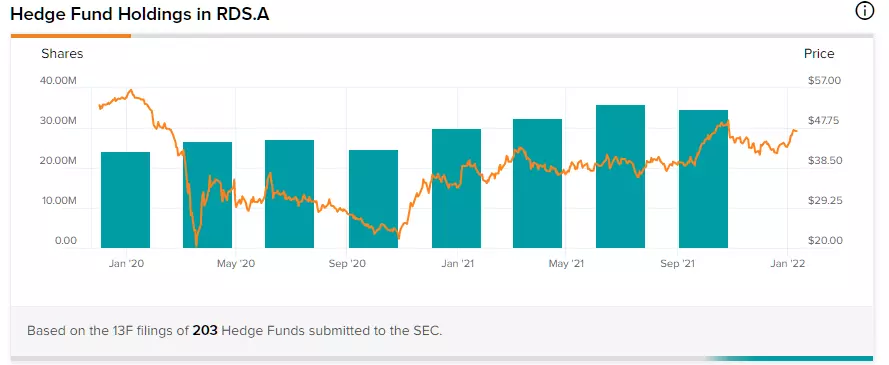
Source: TipRanks, 11 January 2022
Activist investor Dan Loeb of the Third Point hedge fund wrote that Shell is “one of the cheapest large-cap stocks in the world.” While he is pushing for Shell to break up into two entities – one for its traditional energy business and another for renewables – some believe this is an unlikely scenario.
Institutions have also liked the fact Shell is simplifying its corporate structure by ending its dual-class structure. Last year, the company announced plans to move its head office to the UK from the Netherlands due to taxes and climate change pressure.
What are the Analysts’ Royal Dutch Shell Share Price Forecast?
According to analysts polled by FT.com, there are now more ‘buy’ and ‘outperform’ ratings on the Royal Dutch Shell stock price than at the same time last year. Of the 17 analysts offering a 12-month price target, the highest estimate is GBX 4,124.79 with a median estimate of GBX 2,101.43.
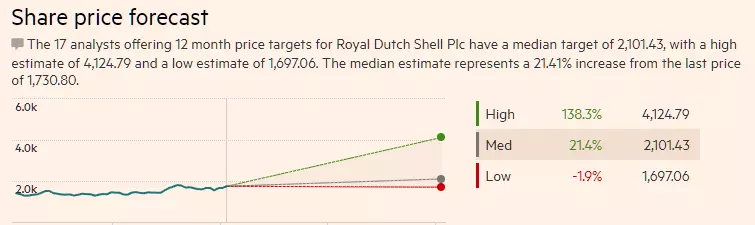
Source: FT.com, 11 January 2022
An Example Trading Idea for the Royal Dutch Shell Share Price
An example trading idea for the Royal Dutch Shell B share price (RDSB) could be as follows:
- Buy the stock on a break above GBX 1,764.00.
- Target the median analyst price target of GBX 2,101.43.
- Keep your risk small at a maximum of 7% of your total account.
- Time Line = 1 – 12 months
- A move to the median price target level would result in a near 20% potential gain.
- Some investors may choose to target the highest analyst price target level of GBX 4,124.79 which would result in a near 133% potential gain over a much longer period of time.
It’s wise to remember that the share price is unlikely to go up in a straight line and it may even go much further down before it rises. The energy market and oil stocks tend to be more volatile than other blue-chip stocks.
Therefore, be sure to exercise good risk management which is one of the most important aspects of trading successfully. You should always know how much you could potentially lose on a trade and the risks involved.
How to Buy Royal Dutch Shares in 4 Steps
With Admirals, you can buy shares in UK companies like Royal Dutch Shell with a low commission of just 0.1% of the trade value and a low minimum commission of just GBP 1.0.
- Open an account with Admirals to access the Trader’s Room.
- Click on Trade on one of your live or demo accounts to open the web platform.
- Search for Shell (RDSB.UK) at the bottom of the Market Watch window and drag the symbol onto the chart.
- Use the one-click trading feature, or right-click and open a trading ticket to input your trade size, stop loss and take profit level.
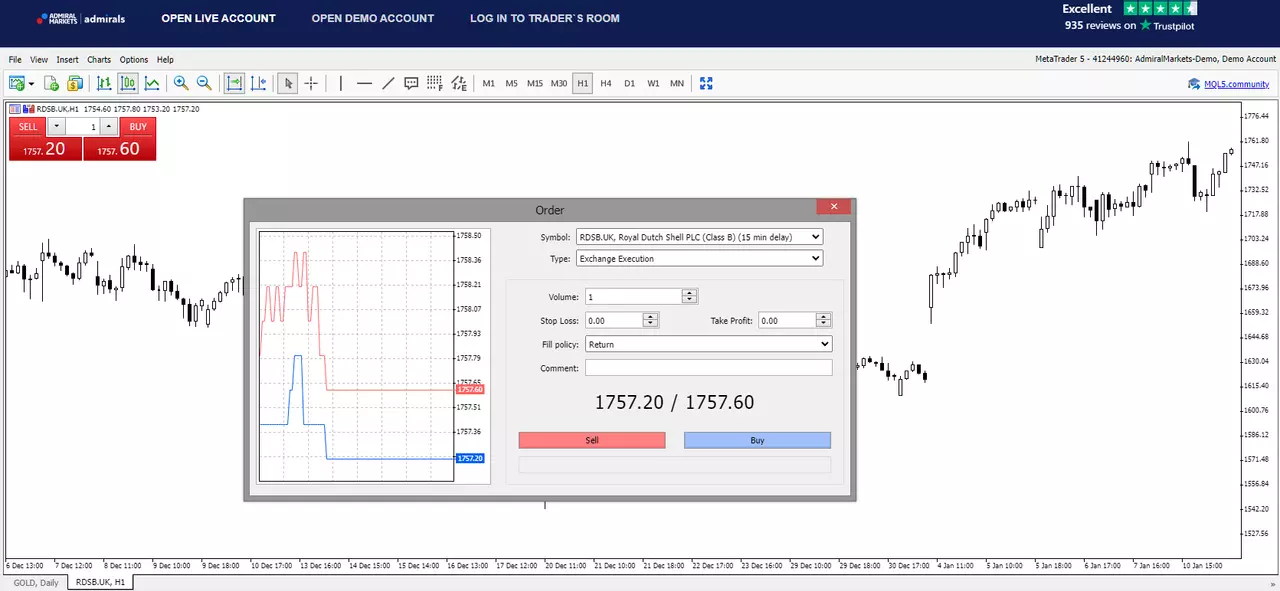
Source: Admirals MetaTrader 5 Web. Past performance is not a reliable indicator of future results, or future performance.
Click on the banner below to buy Shell stock today! ▼▼▼

Do You See the Royal Dutch Shell Share Price Moving Differently?
Remember that all analytics and trading ideas are based on the personal view and experience of the author.
If you believe there is a higher chance that Shell's share price will move lower, then you can also trade short from a CFD (Contracts for Difference) trading account which Admirals also provides.
The Trade.MT5 and Trade.MT4 account allows you to speculate on the price direction of stocks and shares using CFDs.
This means you can trade long and short to potentially profit from rising and falling stock prices. Learn more about CFDs in this How to Trade CFDs article.
INFORMATION ABOUT ANALYTICAL MATERIALS:
The given data provides additional information regarding all analysis, estimates, prognosis, forecasts, market reviews, weekly outlooks or other similar assessments or information (hereinafter “Analysis”) published on the websites of Admirals’ investment firms operating under the Admirals trademark (hereinafter “Admirals”) Before making any investment decisions please pay close attention to the following:
- This is a marketing communication. The content is published for informative purposes only and is in no way to be construed as investment advice or recommendation. It has not been prepared in accordance with legal requirements designed to promote the independence of investment research, and that it is not subject to any prohibition on dealing ahead of the dissemination of investment research.
- Any investment decision is made by each client alone whereas Admirals shall not be responsible for any loss or damage arising from any such decision, whether or not based on the content.
- With a view to protecting the interests of our clients and the objectivity of the Analysis, Admirals has established relevant internal procedures for the prevention and management of conflicts of interest.
- The Analysis is prepared by an independent analyst, Jitan Solanki (analyst), (hereinafter “Author”) based on their personal estimations.
- Whilst every reasonable effort is taken to ensure that all sources of the content are reliable and that all information is presented, as much as possible, in an understandable, timely, precise and complete manner, Admirals does not guarantee the accuracy or completeness of any information contained within the Analysis.
- Any kind of past or modelled performance of financial instruments indicated within the content should not be construed as an express or implied promise, guarantee or implication by Admirals for any future performance. The value of the financial instrument may both increase and decrease and the preservation of the asset value is not guaranteed.
- Leveraged products (including contracts for difference) are speculative in nature and may result in losses or profit. Before you start trading, please ensure that you fully understand the risks involved.

