Good unemployment data leads the SP500 and the Dow Jones to set new all-time highs

After the Easter holiday, only the US markets were open. Despite the lack of activity in the European market, the SP500 and the DJI30 set new all-time highs yesterday. This further prolongs the spectacular rise that the North American stock markets have experienced in recent years, with an upward trend that lasts for more than 10 years.
These increases were supported by the good employment data from last Friday, which were not only better than expected, but far exceeded market expectations. The NFPs showed the creation of 916,000 jobs compared to the 647,000 expected, while data from last February was revised, showing an additional increase of 89,000 jobs, reaching a total of 468,000.
This good data once again shows the strength of the US economy. Together with the current Fed stimulus programs, aid from the federal government, and positive expectations for the future thanks to the vaccination program, it is not surprising that the markets are boosted when it comes to these increases.
The Nasdaq is finally seeing a rise, and although it has not yet recovered its historic highs, companies such as Microsoft or Facebook have reached new historical highs despite problems such as Facebook’s recent data leak of several million users.
If we look at the US100, technically speaking, it is at a very interesting point, as it is currently fighting to overcome its current resistance level (green) after breaking the short-term bearish trend line (in dotted red) which has led him to make 4 consecutive raises.
The break of this level, would open the doors to seek again its zone of historical maximums reached last February since a major correction began due to the increase in US bond yields.
If the price is not able to break above this level, we could find a rebound in search of its 18-session black moving average that would currently be its first support level in the zone coinciding with the 23.6% fibonacci level.
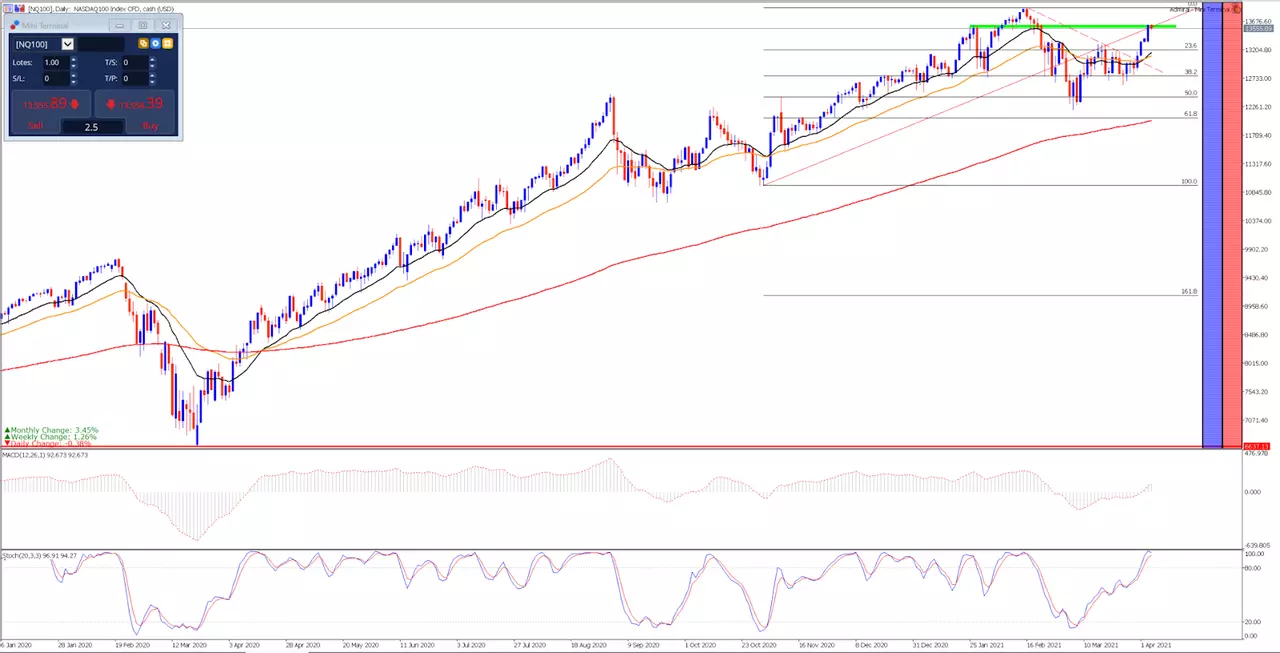
Source: Nasdaq daily chart of Admiral Markets MetaTrader 5 platform from January 6, 2020 to April 6, 2021. Taken on April 6 at 1:15 PM CEST. Note: Past performance is not a reliable indicator of future results, or future performance.
Price evolution of the last 5 years:
- 2020: 43.64%
- 2019: 35.23%
- 2018: -3.88%
- 2017: 28.24%
- 2016: 7.50%
With the Admiral Markets Trade.MT5 account, you can trade Contracts for Differences (CFDs) of all the leading indices! CFDs allow traders to try to profit from the bull and bear markets, as well as the use of leverage. Click on the following banner to open an account today:
INFORMATION ABOUT ANALYTICAL MATERIALS:
The given data provides additional information regarding all analysis, estimates, prognosis, forecasts, market reviews, weekly outlooks or other similar assessments or information (hereinafter “Analysis”) published on the websites of Admiral Markets investment firms operating under the Admiral Markets trademark (hereinafter “Admiral Markets”) Before making any investment decisions please pay close attention to the following:
- This is a marketing communication. The content is published for informative purposes only and is in no way to be construed as investment advice or recommendation. It has not been prepared in accordance with legal requirements designed to promote the independence of investment research, and that it is not subject to any prohibition on dealing ahead of the dissemination of investment research.
- Any investment decision is made by each client alone whereas Admiral Markets shall not be responsible for any loss or damage arising from any such decision, whether or not based on the content.
- With view to protecting the interests of our clients and the objectivity of the Analysis, Admiral Markets has established relevant internal procedures for prevention and management of conflicts of interest.
- The Analysis is prepared by an independent analyst, Roberto Rojas (analyst), (hereinafter “Author”) based on their personal estimations.
- Whilst every reasonable effort is taken to ensure that all sources of the content are reliable and that all information is presented, as much as possible, in an understandable, timely, precise and complete manner, Admiral Markets does not guarantee the accuracy or completeness of any information contained within the Analysis.
- Any kind of past or modeled performance of financial instruments indicated within the content should not be construed as an express or implied promise, guarantee or implication by Admiral Markets for any future performance. The value of the financial instrument may both increase and decrease and the preservation of the asset value is not guaranteed.
- Leveraged products (including contracts for difference) are speculative in nature and may result in losses or profit. Before you start trading, please ensure that you fully understand the risks involved.

