The French oil company Total announces severe losses for 2020
Today, the French oil company Total announced its earnings results for 2020. This comes at great interest, as it has been influenced by the situation generated by the pandemic and the sharp decline in oil prices and demand over the past year.
Because of this, Total announced losses amounting to $7.24 billion in profit compared to the $11.27 billion for 2019, despite the stabilization of the price of crude oil thanks to the different reduction measures carried out by OPEC at the end of the year. These led to a profit of $891 million, 202 million more than in the third quarter, which is a positive note for the future.
This company has also announced that it has suffered a strong depreciation of its assets and a reduction in its daily production by 5%.
Looking ahead, the positive evolution of oil in recent weeks has given Total a break, since, despite the fact that the vaccination process has not finished, optimism for the future has grown since it is expected that the vaccines will manage to stop this pandemic, which has led Brent and WTI to reach levels not seen in the last year. Although the upward trend has slowed for the second half of January, February is showing very positive growth which has led the price of crude to reach $60 per barrel.
It is important to watch how this process evolves, because if the pandemic remains uncontrolled and new strains cannot be stopped by existing vaccines, new measures could be taken which may affect the economy and drag the oil sector back down.
Technically speaking, this company is in a strong and wide lateral range since it reached its lows last March and the level of 39 euros per share. Currently, the price is in a triangular formation with a flat base between the short-term downtrend line and the red support range after finally breaking through its 200-session moving average, which could indicate a trend change from bearish to bullish if this triangle finally breaks its resistance level.
If we observe its oscillating indicators, we cannot observe any divergence with the price, although we can observe how the stochastic has exceeded its oversold level, which can lead us to think about a positive future in the short term.
If it finally manages to break up this technical formation, the price will have to face its resistance at levels of last June around 39 euros per share, so it is essential to exceed this level so that we can conclude that the change has occurred. trending.
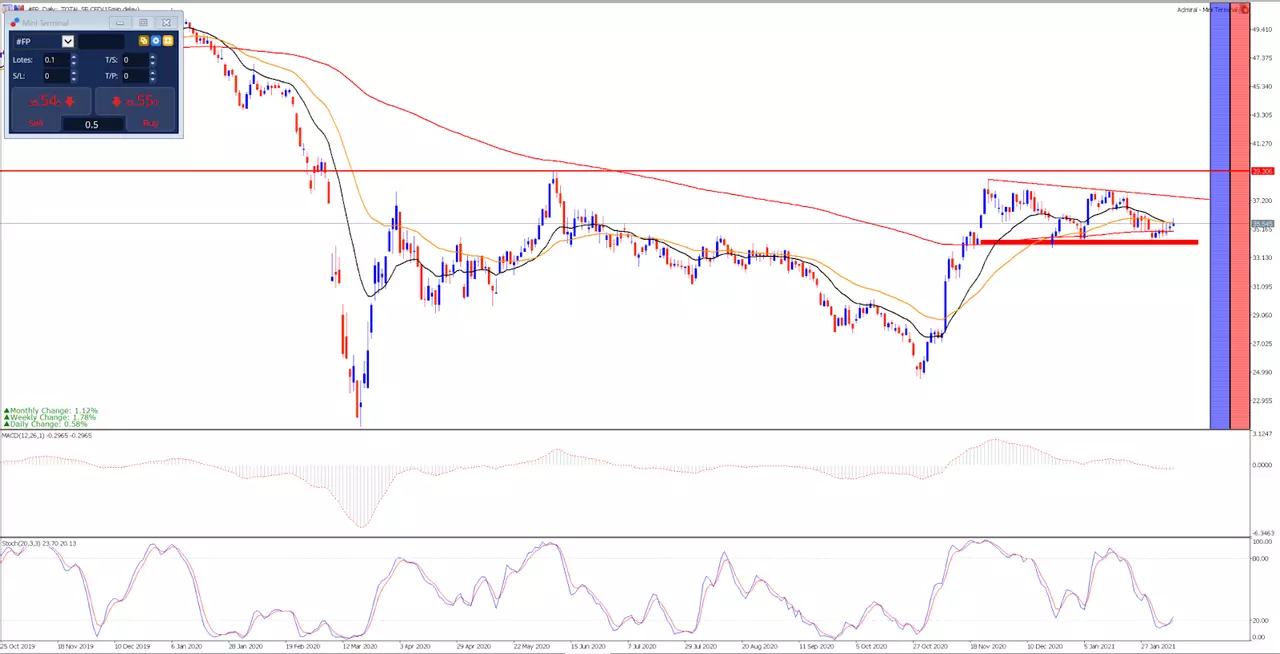
Source: Admiral Markets MetaTrader 5. Total daily graph Data range: from October 25, 2019 to February 9, 2021. Prepared on February 9, 2021 at 12:20 CET. Keep in mind that past returns do not guarantee future returns.
Price evolution in the last 5 years:
- 2020: -28.25%
- 2019: 6.54%
- 2018: 0.29%
- 2017: -5.49%
- 2016: 18.07%
With the Admiral Markets Trade.MT5 account, you can trade Contracts for Differences (CFDs) of Total and more than 3000 stocks! CFDs allow traders to try to profit from the bull and bear markets, as well as the use of leverage. Click on the following banner to open an account today:
INFORMATION ABOUT ANALYTICAL MATERIALS:
The given data provides additional information regarding all analysis, estimates, prognosis, forecasts, market reviews, weekly outlooks or other similar assessments or information (hereinafter “Analysis”) published on the websites of Admiral Markets investment firms operating under the Admiral Markets trademark (hereinafter “Admiral Markets”) Before making any investment decisions please pay close attention to the following:
- This is a marketing communication. The content is published for informative purposes only and is in no way to be construed as investment advice or recommendation. It has not been prepared in accordance with legal requirements designed to promote the independence of investment research, and that it is not subject to any prohibition on dealing ahead of the dissemination of investment research.
- Any investment decision is made by each client alone whereas Admiral Markets shall not be responsible for any loss or damage arising from any such decision, whether or not based on the content.
- With view to protecting the interests of our clients and the objectivity of the Analysis, Admiral Markets has established relevant internal procedures for prevention and management of conflicts of interest.
- The Analysis is prepared by an independent analyst, Roberto Rojas (analyst), (hereinafter “Author”) based on their personal estimations.
- Whilst every reasonable effort is taken to ensure that all sources of the content are reliable and that all information is presented, as much as possible, in an understandable, timely, precise and complete manner, Admiral Markets does not guarantee the accuracy or completeness of any information contained within the Analysis.
- Any kind of past or modeled performance of financial instruments indicated within the content should not be construed as an express or implied promise, guarantee or implication by Admiral Markets for any future performance. The value of the financial instrument may both increase and decrease and the preservation of the asset value is not guaranteed.
- Leveraged products (including contracts for difference) are speculative in nature and may result in losses or profit. Before you start trading, please ensure that you fully understand the risks involved.