How to trade chart patterns: Gold’s Head-Shoulder Formation
There are numerous chart formations in the world of trading: head-shoulder, ascending/falling wedges, triangles, harmonic patterns, etc., to name only a few.
Today, we want to focus on a specific chart formation which is currently developing in Gold: a head-shoulder formation on a daily time frame, and how to formulate an a strategy to trade it.
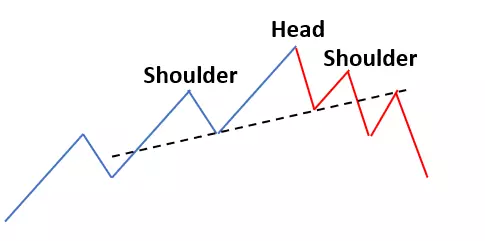
The Head-Shoulder formation
Before we'll look at the formation in Gold, we have to make sure that we know what we are looking for. In theory, the head and shoulder formation is a classic trend reversal formation.
'Trend reversal formation' means that charts show a reversal of an existing trend, for example, a sequence of higher highs followed by higher lows.
This sequence is then followed by a structure of falling highs and lows, which allows for strong opportunities to trade.
Here an interesting side note: some technical traders prefer the resulting neckline to rise, some prefer a falling neckline, some have no preference.
No matter which "neckline style" you prefer, by dropping perpendicular from the "head" of the formation to the neckline, you get a chance to project a potential target on the downside if the pattern pans out.
In the following, let's use this theoretical knowledge and adopt it to the current technical picture we see in Gold on a daily time frame.
Application of the head-shoulder formation in Gold
When looking at the daily chart below, one can clearly spot a sequence of higher highs and lows (marked in red) during the period between August 2018 through February 2019:
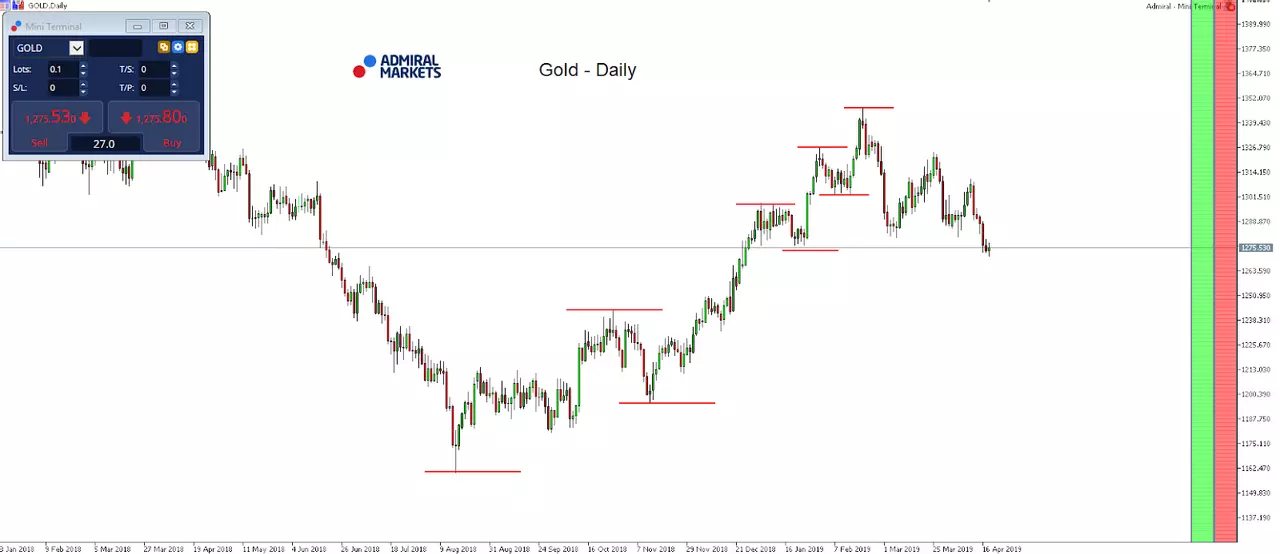
Source: Admiral Markets MT5 with MT5-SE Add-on Gold Daily chart (between January 23, 2018 to April 18, 2019). Accessed: April 18, 2019, at 15:30 GMT - Please note: Past performance is not a reliable indicator of future results, or future performance.
From the beginning of March 2019, Gold saw a sharp drop, and started to consolidate in a range between 1,275 and 1,346 USD without ever trying to take out the former highs again.
Into the end of March/at the beginning of the month of April the head-shoulder formation started to shape: in turquoise, we can see an initial sequence of falling highs and lows which were confirmed with a break below 1,275 USD.
The break of the neckline and attempt to break below 1,275 USD occurred on the April 16.

Source: Admiral Markets MT5 with MT5-SE Add-on Gold Daily chart (between January 23, 2018 to April 18, 2019). Accessed: April 18, 2019, at 15:30 GMT - Please note: Past performance is not a reliable indicator of future results, or future performance.
How could a potential trading setup for Gold look like?
One approach would be to wait for a re-test of the neckline, currently in the region around 1,290 USD.
Since the projected target on the downside can be found around 1,235 USD, this is where a potential buy limit would be set, resulting in a potential reward of 55 USD.
A potential stop loss level can be found at 1,310 USD, resulting in a potential risk of 20 USD and that said a potential risk-reward of the trade of 20 USD : 55 USD or 1 : 3.6:
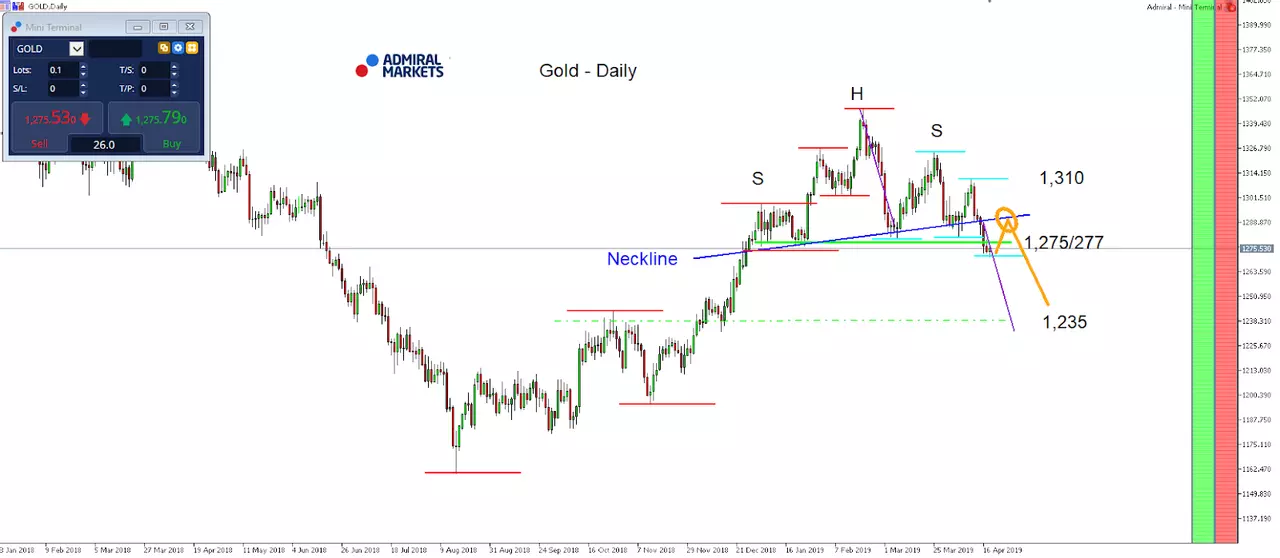
Source: Admiral Markets MT5 with MT5-SE Add-on Gold Daily chart (between January 23, 2018 to April 18, 2019). Accessed: April 18, 2019, at 15:30 GMT - Please note: Past performance is not a reliable indicator of future results, or future performance.
In 2014, the value of Gold fell by 1.7%, in 2015, it fell by 10.4%, in 2016 it increased by 8.1%, in 2017, it increased by 13.1%, in 2018, it fell by 1.6%, meaning that after five years, it was up by 6.4%.
Check out Admiral Markets' most competitive conditions on the DAX30 CFD and start trading on the DAX30 CFD with a low 0.8 point spread offering during the main Xetra trading hours. To test Admiral Markets DAX offering in combination with the described strategy above register for a free demo account today and experience the live market risk free!
Disclaimer: The given data provides additional information regarding all analysis, estimates, prognosis, forecasts or other similar assessments or information (hereinafter "Analysis") published on the website of Admiral Markets. Before making any investment decisions please pay close attention to the following:
- This is a marketing communication. The analysis is published for informative purposes only and are in no way to be construed as investment advice or recommendation. It has not been prepared in accordance with legal requirements designed to promote the independence of investment research, and that it is not subject to any prohibition on dealing ahead of the dissemination of investment research.
- Any investment decision is made by each client alone whereas Admiral Markets shall not be responsible for any loss or damage arising from any such decision, whether or not based on the Analysis.
- Each of the Analysis is prepared by an independent analyst (Jens Klatt, Professional Trader and Analyst, hereinafter "Author") based on the Author's personal estimations.
- To ensure that the interests of the clients would be protected and objectivity of the Analysis would not be damaged Admiral Markets has established relevant internal procedures for prevention and management of conflicts of interest.
- Whilst every reasonable effort is taken to ensure that all sources of the Analysis are reliable and that all information is presented, as much as possible, in an understandable, timely, precise and complete manner, Admiral Markets does not guarantee the accuracy or completeness of any information contained within the Analysis. The presented figures refer that refer to any past performance is not a reliable indicator of future results.
- The contents of the Analysis should not be construed as an express or implied promise, guarantee or implication by Admiral Markets that the client shall profit from the strategies therein or that losses in connection therewith may or shall be limited.
- Any kind of previous or modeled performance of financial instruments indicated within the Publication should not be construed as an express or implied promise, guarantee or implication by Admiral Markets for any future performance. The value of the financial instrument may both increase and decrease and the preservation of the asset value is not guaranteed.
- The projections included in the Analysis may be subject to additional fees, taxes or other charges, depending on the subject of the Publication. The price list applicable to the services provided by Admiral Markets is publicly available from the website of Admiral Markets.