Investing in South African Stocks
South Africa’s Johannesburg Stock Exchange (JSE) is home to many of the continent's top companies, spanning a range of different industries. In this article, we will highlight three of the top South African stocks listed on the JSE and examine their advantages and risks in 2026.
The information in this article is provided for educational purposes only and does not constitute financial advice. Consult a financial advisor before making investment decisions.

The Johannesburg Stock Exchange: Background
Founded in 1887, the Johannesburg Stock Exchange (JSE) is the largest stock exchange in Africa and home to many of the continent’s largest public companies.
In total, there are around 400 companies listed on the JSE which, in terms of market capitalisation, are dominated by miners, banks and consumer focused groups. However, there is also growing representation from other industries such as technology and renewable energy.
Top South African Stocks
In the following sections, we will take a look at some of the top JSE stocks this year, highlight their performances and explain what to look out for.
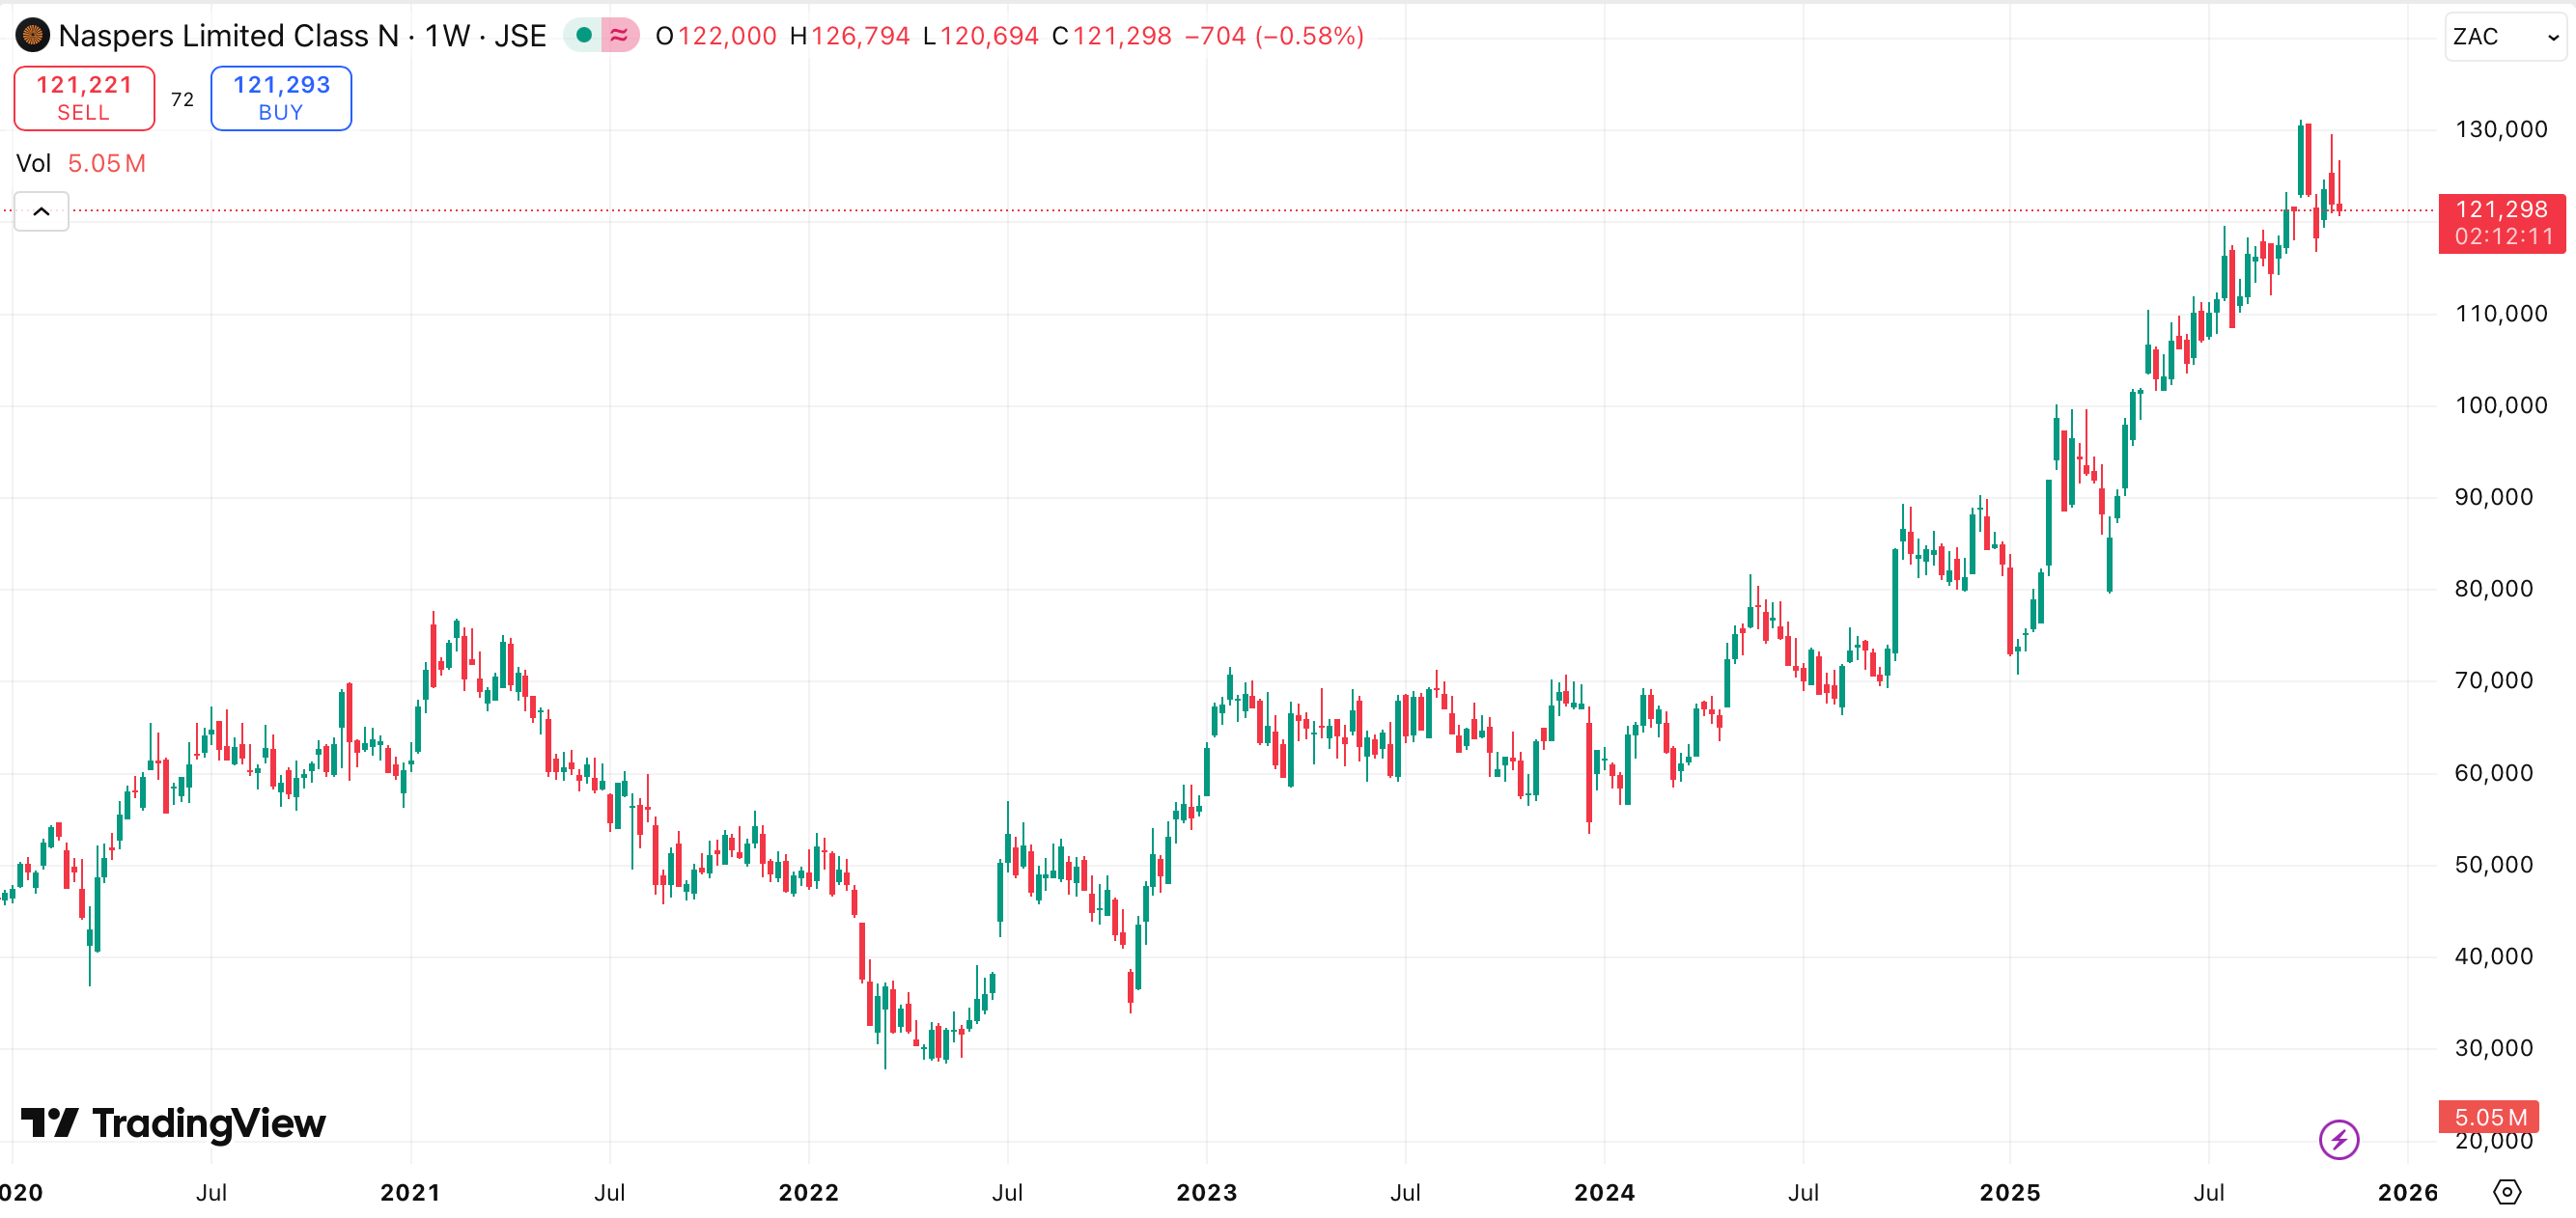
Naspers
Naspers is a multinational holding company, the largest company in South Africa in terms of market cap and one of the largest technology investors in the world.
It is the majority owner of Prosus, a global consumer internet group through which the majority of Naspers’s international business is owned. Prosus was spun off from Naspers in 2019 and listed on the Euronext Amsterdam, with Naspers retaining a 57% stake in the company.
Prosus wholly or partially owns a range of internet and technology companies around the world. Its wholly owned subsidiaries include OLX Group and Stack Overflow, whilst it also holds significant minority stakes in companies such as Tencent and Remitly.
Consequently, Naspers provides shareholders with exposure to a diversified portfolio of companies around the world, most notably Tencent - a leading Chinese tech company which owns “super app” WeChat and is the world’s largest video game company.
It also offers this diversification at a discount, with Naspers consistently trading considerably below the value of its assets. Indeed, as of 5 November 2025, Naspers traded at around a 40% discount to its net asset value.
Naspers has been taking steps to reduce the discount gap for some time, but it continues to persist. Whilst the discount may make it sound attractive, the gap is by no means guaranteed to close and could persist indefinitely.
Another factor to consider is that much of Naspers’s value depends on its indirect stake in Tencent. This could make it vulnerable in the future to potential geopolitical tensions or shifting Chinese tech regulations.
AngloGold Ashanti
AngloGold Ashanti was formed in 2004 as a result of the merger of AngloGold and Ashanti Goldfields Corporation. It is the sixth largest gold mining company in the world in terms of production.
As the name suggests, AngloGold is primarily a gold mining company, although it does also produce silver as a by-product of its gold mining operations.
Consequently, AngloGold offers investors exposure to gold without investing in the physical commodity itself.
However, as the precious metal accounts for the vast majority of revenue, AngloGold is heavily dependent on gold prices. Whilst this has resulted in share price performing well over the last couple of years, a drop in gold prices would likely have the opposite effect and is a risk which should be considered by potential investors.
In the year ended 31 December 2024, AngloGold produced 2.66 million ounces of gold and 3.75 million ounces of silver, reporting revenue of $5.8 billion and a pretax profit of $1.7 billion.
The gold miner has paid a dividend each year since 2017 and currently has a dividend yield of around 2.5%. Of course, it’s important to remember that future dividends are never guaranteed.
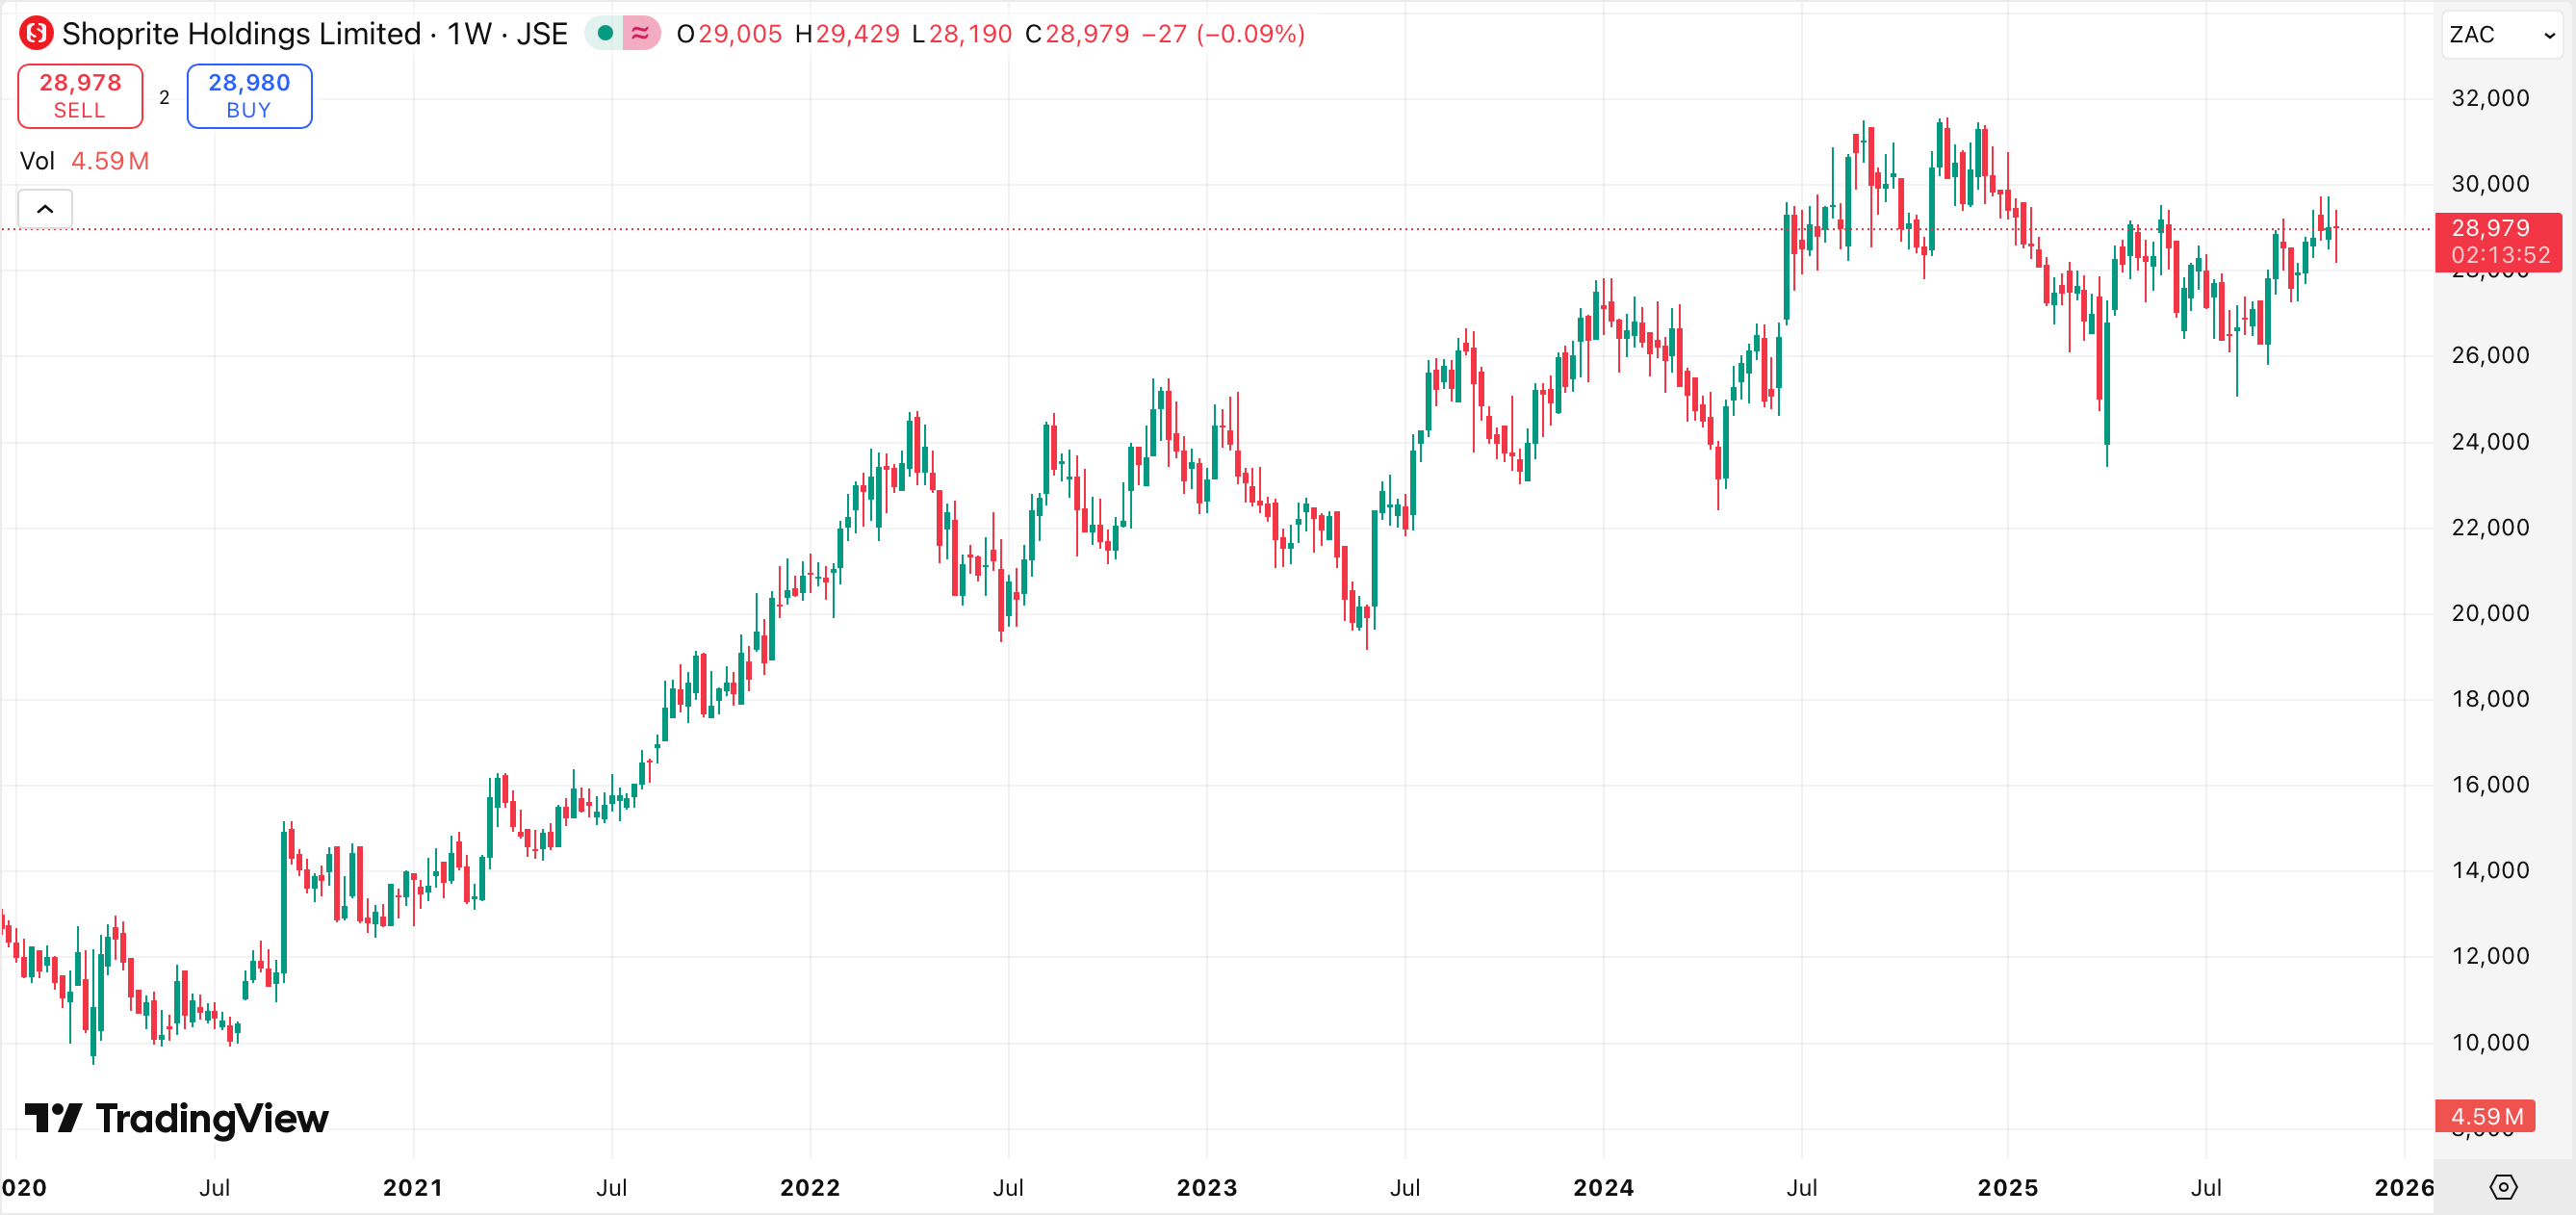
Shoprite
Shoprite is South Africa’s largest retailer by a number of metrics including market cap and revenue. As well as its namesake supermarket chain, it operates a number of other retail brands including Usave, Checkers, Freshmark and House & Home.
Through its brands, the group sells consumer staples such as food, drink and healthcare products. These are the type of essentials that people tend to buy regardless of what’s going on in the wider economy, giving the stock defensive characteristics.
Its defensive nature is reinforced by Shoprite’s diverse customer base thanks to its different brands. For example, whilst its discount brand Usave appeals to cost-conscious shoppers, Checkers targets the more affluent end of the market.
In the year ending 29 June 2025, the group's revenue rose by 8.6% to R257 billion and operating profit rose 17.5% to R15 billion.
It’s worth bearing in mind that, largely due to the high level of competition, supermarkets tend to be low margin businesses, relying on high sales volume to generate profit. In 2025, Shoprite’s operating margin was less than 6%.
Subsequently, Shoprite may be sensitive to scenarios where costs rise or sales fall, either of which can further erode already thin margins and squeeze profitability.
Shoprite has paid a dividend every year since 1996, with the stock currently yielding 2.7%, although future dividends are not guaranteed.
Other Articles You Might Be Interested In:
Frequently Asked Questions
How many stocks are on the JSE?
There are around 400 companies listed on the Johannesburg Stock Exchange.
Who are the top 40 JSE listed companies?
The largest 40 JSE companies in terms of market capitalisation form a stock index known as the JSE Top 40 Index.
The given data provides additional information regarding all analysis, estimates, prognosis, forecasts, market reviews, weekly outlooks or other similar assessments or information (hereinafter “Analysis”) published on the websites of Admirals investment firms operating under the Admirals trademark (hereinafter “Admirals”) Before making any investment decisions please pay close attention to the following:
- This is a marketing communication. The content is published for informative purposes only and is in no way to be construed as investment advice or recommendation. It has not been prepared in accordance with legal requirements designed to promote the independence of investment research, and that it is not subject to any prohibition on dealing ahead of the dissemination of investment research.
- Any investment decision is made by each client alone whereas Admirals shall not be responsible for any loss or damage arising from any such decision, whether or not based on the content.
- With view to protecting the interests of our clients and the objectivity of the Analysis, Admirals has established relevant internal procedures for prevention and management of conflicts of interest.
- The Analysis is prepared by an analyst (hereinafter “Author”). The Author Roberto Rivero is a contractor for Admirals. This content is a marketing communication and does not constitute independent financial research.
- Whilst every reasonable effort is taken to ensure that all sources of the content are reliable and that all information is presented, as much as possible, in an understandable, timely, precise and complete manner, Admirals does not guarantee the accuracy or completeness of any information contained within the Analysis.
- Any kind of past or modelled performance of financial instruments indicated within the content should not be construed as an express or implied promise, guarantee or implication by Admirals for any future performance. The value of the financial instrument may both increase and decrease and the preservation of the asset value is not guaranteed.
- Leveraged products (including contracts for difference) are speculative in nature and may result in losses or profit. Before you start trading, please ensure that you fully understand the risks involved.