The 7 Best Trading Patterns for the Forex and CFD Markets

What is the best stock chart pattern? Most of you appreciate trading patterns, but not all of them are equally relevant, and some patterns may even turn out to be coincidental.
When you're finished reading this article, you will know exactly which price and market patterns have the most relevance when trading within the market structure.
This article will answer the question, "How do you identify a trading pattern?" and provide a full overview of which patterns are useful and beneficial for Forex, CFD, and commodity traders. Consider this your trading pattern cheat sheet.
Table of Contents
How to Differentiate Relevant and Non-Relevant Trading Patterns?
In the world of technical analysis, there are tons of established patterns visible on charts each trading day and week. Why?
A pattern is simply a regular repetition of the price movement. Chart and candlestick patterns are two popular examples, and we'll dive into many of them in today's article.
Please mind that not all patterns are mentioned here, which doesn't qualify them as less respected pattern formations. You might discover how the AUD/USD respects the 50% Fibonacci level after a trend line break, which is a valuable pattern to know.
Some patterns are not as useful. For instance, a trader who sees a pattern of the EUR/USD moving lower after their favourite football team loses is being a bit too creative. These two variables are obviously not correlated to each other.
In this article, I will discuss 3 simple trading patterns. I can't say that they are the top 3 trading patterns, but they are well-known and widely used. They are also used in the live trading webinars (see below). Then I'll present more trading patterns that could be useful for you to study in your trading.
Candlestick Patterns
In my view, candlestick patterns represent the most important pattern as price action is simply the most direct method of understanding the market psychology. The candlestick patterns offer assistance in:
- Seeing the correct trend and direction: Strong bullish or bearish weekly candle, for instance, can indicate a trend continuation next week.
- Trading bounces and reversals: Candlestick patterns at support or resistance could confirm a potential turnaround.
- Measuring breakouts: A strong candle closing near a high or low could show that the price is breaking below support or above resistance.
Candlestick patterns are my favourite method for confirming an anticipated trade in my decision zone. In the image below, you see engulfing twins (blue boxes) break above the resistance trend lines (orange), which, in fact, represent examples of chart patterns (bull flag). This is our next focus.
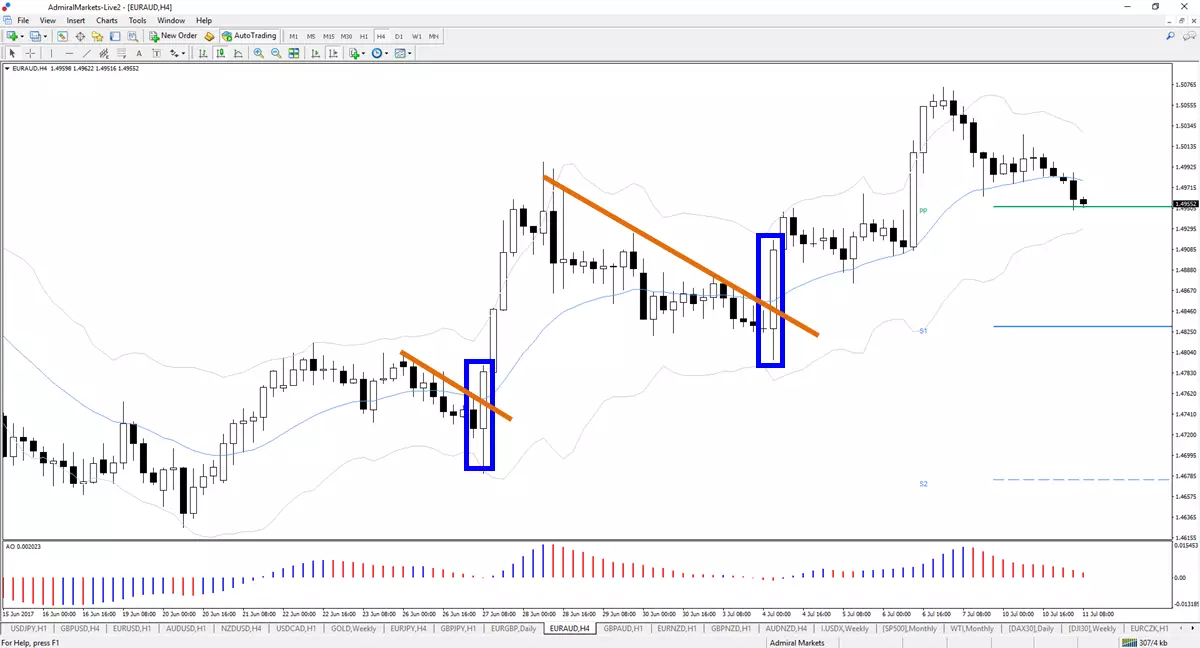
Source: MT4SE platform showing EUR/AUD, 4-hour chart from 15 June to 11 July 2017.
Chart Patterns
Chart patterns are valuable as well because they indicate the psychology behind the market and answer such important aspects as:
- Is price action showing a reversal or a continuation?
- Is price action bullish or bearish?
Continuation: Bull flags are considered to be bullish continuation patterns, whereas bear flags are logically bearish continuation patterns.
Reversal: The head-and-shoulders pattern is a famous bearish reversal pattern, whereas the inverted head-and-shoulders pattern is a bullish reversal example. Other examples of reversal patterns are rising (bearish) and falling wedges (bullish).
Fibonacci Patterns
The price loves to respect the Fibonacci levels, but it is important to know how to draw with the Fib tool and when to use it. The price will tend to retrace towards the Fibonacci levels and use one of them to continue with the trend. It is vital to keep the following in mind:
- Fibonacci levels work best when the market is trending.
- The price can bounce and retrace to multiple Fib levels before the trend continues.
- The price usually goes to the Fibonacci target levels as well.
Simply said, the Fibonacci levels provide excellent value for entering and exiting the market, but it is important to understand the tool in more detail first. It is not recommended to use it for signals without properly applying the tool.
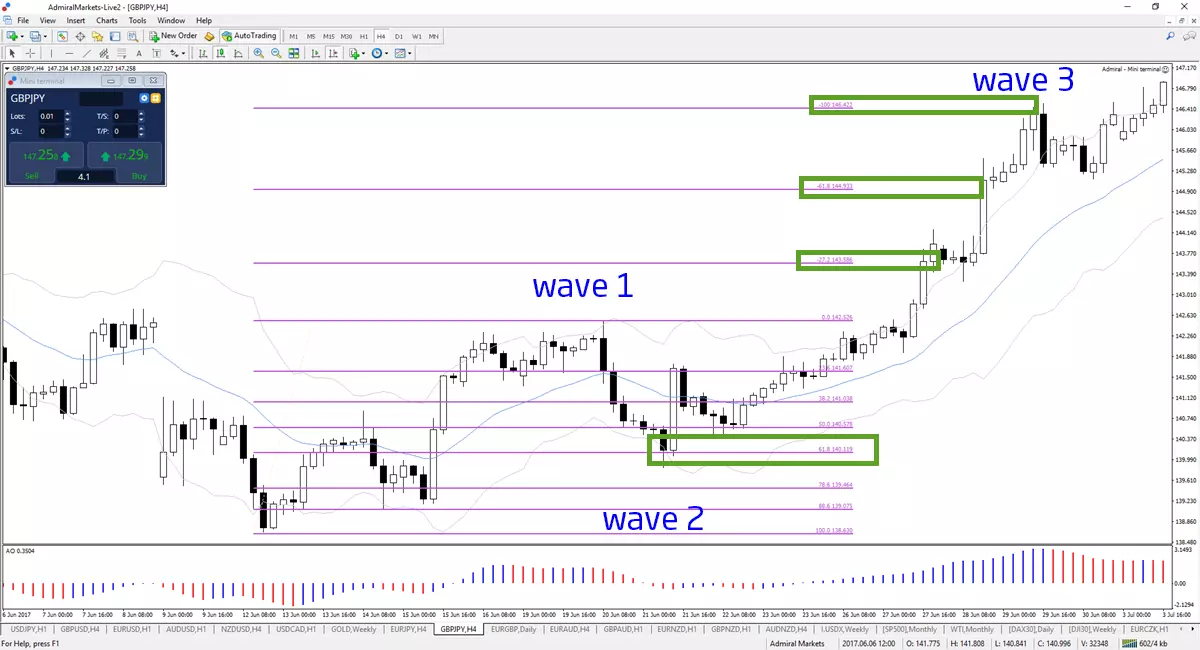
Source: MT4SE platform showing GBP/JPY, 4-hour chart from 6 June to 3 July 2017.
Let's look at some more. While it's hard to say which patterns are most commonly studied by traders, the following trading patterns are well-known.
Wave Patterns
The Fibonacci levels go hand-in-hand with wave patterns. The Fibonacci levels are best-plotted on a swing which is considered to be one piece according to the wave analysis.
The Elliott Wave Theory also helps traders understand the market psychology in general and what type of price action could be expected with the next price action swings.
Wave analysis is really analysing price action swings and estimating how the next swing will develop in this series. Basically, the price can be moving in several ways:
- In an uptrend, downtrend, or range.
- Quick (impulsive/momentum) or slow (corrective).
Divergence Patterns
Divergence patterns are the important warning signals for the end of the trend. These patterns often are an early sign of an upcoming reversal. This is especially true if there are multiple diverge patterns on one time and/or multiple divergences on multiple time frames of the instrument.
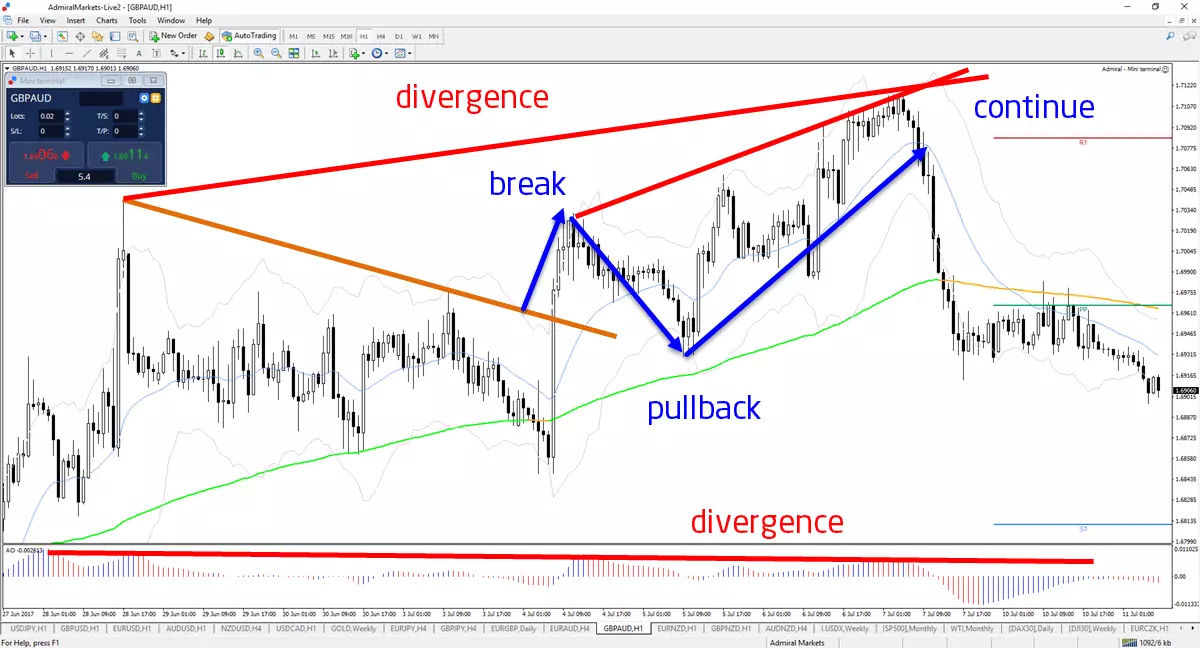
Source: MT4SE platform showing GBP/AUD, 1-hour chart from 27 June to 11 July 2017.
BPC at Trend Line Patterns
Price action often builds a BPC pattern at the trend line. The BPC stands for Break, Pullback, and Continue and often occurs when the price manages to break a trend line.
I am a huge fan of drawing trend lines on my chart to see where the major channels as well as the key support and resistance lines are located. As the price is approaching them, I am always on the lookout for BPC.
Time Patterns
Last but not least, time patterns. Price action is of key importance to understanding momentum, correction, candlestick patterns, and chart patterns, but the second part of the chart is also relevant – time. There are more than a dozen time patterns, such as the expected market movement during the various trading sessions of the day.
My favourite method is, however, counting candles, since a new high or low is visible on the chart. Lack of a new high or low within 5 to 6 candles often reveals the potential for a correction or reversal. Find out more information on this time pattern here. For more articles, webinars, and information on trading, make sure to visit our main page at Admiral Markets.
ABC Pattern
The ABC pattern is a key example of market symmetry. It has a pattern called ABCD pattern trading. These patterns help traders identify opportunities for buying and selling in every market in every time frame. The primary advantage of trading these patterns is that traders can use them to assess risk-reward ratios early while they are predicting turning points in the market as they aim for profit targets. Here, I will describe how to use “ABC” patterns.
The ABC pattern is either a continuous or reversal pattern and has the shape of a lightning bolt. The key step in identifying this pattern is to correctly identify the A, B and C pivot points in the chart as they form.
Traders can detect these points by looking at the swinging highs and lows at different levels along with the waves of correction to identify distinct swings. The C point is often predicted by using the Fibonacci retracements of the AB swing.
When the A, B and C points (along with the AB, BC legs) are detected, then an algorithm used to determine the Potential Completion Zone (PCZ). The PCZ zone is where a trader can expect the ABC pattern to finish and might indicate a continuation of the trend in the first direction (AB).
After the BC leg completes, the AB and BC leg projections (using Fibonacci ratios) can be drawn (from C) to create targets. With this ABC pattern, one trades it in the trend direction of the AB from C to D.
It's time I mention that, when using any pattern, it is always best to use a double confirmation with another pattern to detect a weak or false trend.
Head and Shoulders Pattern
The Head and Shoulders trading pattern is a widely used chart pattern, providing easy to understand sell and buy signals.
Here are the primary components of a head and shoulder pattern:
-
Left Shoulder
Bullish trends set new highs. However, these highs don't last long and prices fall.
-
Head
Still, the prices don't fall for long as bulls push them back up. This time, they surpass the previous highs. This is a bullish sign. The prices may fall again, but they, again, find support.
-
Right Shoulder
The bulls push the price higher again, but they fail to break past the previous high. This is considered bearish because the bears have succeeded in letting bulls push it to an equal high or new highs.
The price then falls back to the support on the Confirmation line. This is a crucial moment. Bulls might try to take the price higher, or bears may ultimately stop the rising trend.
Sell signals in the Head and Shoulders Pattern
If the price falls below this confirmation line, this usually means that bears are in control. Therefore, when the price falls below this line, this is seen as a potential sell signal.
A downward sloping confirmation line is considered a more powerful pattern, overall. This is primarily because a downward sloping line indicates that the prices are reaching deeper lows.
Diamond Pattern
Traders use diamond pattern trading to detect reversals. Once they are correctly identified, it can be a helpful pattern to use with a reversal trading strategy. It is a rare formation that resembles the Head and Shoulders, but with a V shaped neckline.
Harmonic Pattern
The harmonic trading patterns are those that form geometric patterns to the next level by using numbers from the Fibonacci pattern to identify exact turning points. Unlike some more commonly used methods, harmonic trading patterns are used to help identify future price movements.
Triangle Pattern
A triangle trading pattern is a chart pattern, formed by drawing trend lines along a converging price range. This indicates a pause in the current trend.
Triangles share similarities with pennants and wedges and are seen either as a continuation pattern, if the right pattern is validated, or as a reversal pattern, in the case that it fails.
There are three potential variations of the triangle pattern that may develop as the price action forms a holding pattern:
- Ascending
- Descending
- Symmetrical triangles
Flag Pattern
In technical analysis, a flag is what analysts call a price pattern in a short time frame that moves against the current trend over observed over the long time frame on the price chart. It's called 'Flag pattern trading' because of its shape sometimes reflects a flag hanging on a flagpole.
Traders often use this pattern to detect a potential continuation of a current trend from the point from which the price has countered that same trend. If the trend resumes, then the price rise may be rapid, which traders might use as a signal to enter a specific trade.
Investing in Forex with Admiral Markets
Admiral Markets offers professional traders the ability to trade with a custom, upgraded version of MetaTrader 5, allowing you to experience trading at a significantly higher, more rewarding level. Experience benefits such as the addition of the Market Heat Map, so you can compare various currency pairs to see which ones might be lucrative investments, access real-time trading data, and so much more. Click the banner below to start your FREE download of MT5 Supreme Edition!
Other articles that might interest you:
- Mining stocks - How to invest in them
- Investing in Precious Metals: A complete guide
- Recognize Market Movers to Improve Your Trading
Disclaimer: The given data provides additional information regarding all analysis, estimates, prognosis, forecasts or other similar assessments or information (hereinafter "Analysis") published on the website of Admiral Markets. Before making any investment decisions please pay close attention to the following:
- This is a marketing communication. The analysis is published for informative purposes only and is in no way to be construed as investment advice or recommendation. It has not been prepared in accordance with legal requirements designed to promote the independence of investment research, and that it is not subject to any prohibition on dealing ahead of the dissemination of investment research.
- Any investment decision is made by each client alone whereas Admiral Markets shall not be responsible for any loss or damage arising from any such decision, whether or not based on the Analysis.
- Each of the Analysis is prepared by an independent analyst (Jens Klatt, Professional Trader and Analyst, hereinafter "Author") based on the Author's personal estimations.
- To ensure that the interests of the clients would be protected and objectivity of the Analysis would not be damaged Admiral Markets has established relevant internal procedures for prevention and management of conflicts of interest.
- Whilst every reasonable effort is taken to ensure that all sources of the Analysis are reliable and that all information is presented, as much as possible, in an understandable, timely, precise and complete manner, Admiral Markets does not guarantee the accuracy or completeness of any information contained within the Analysis. The presented figures refer that refer to any past performance is not a reliable indicator of future results.
- The contents of the Analysis should not be construed as an express or implied promise, guarantee or implication by Admiral Markets that the client shall profit from the strategies therein or that losses in connection therewith may or shall be limited.
- Any kind of previous or modelled performance of financial instruments indicated within the Publication should not be construed as an express or implied promise, guarantee or implication by Admiral Markets for any future performance. The value of the financial instrument may both increase and decrease and the preservation of the asset value is not guaranteed.
- The projections included in the Analysis may be subject to additional fees, taxes or other charges, depending on the subject of the Publication. The price list applicable to the services provided by Admiral Markets is publicly available from the website of Admiral Markets.
- Leveraged products (including contracts for difference) are speculative in nature and may result in losses or profit. Before you start trading, you should make sure that you understand all the risks.

