How to Master Forex Market Structure in 3 Simple Steps

Do you sometimes feel lost and confused seeing price action abruptly turn around seemingly out of the blue, and head in the opposite direction?
This feeling can be highly frustrating, but every cloud has a silver lining: understanding the market structure has vastly improved my ability to read price charts and determine decent entry zones.
This article offers a simple 3-step guide on how to approach and dissect the market structure of any Forex, CFD, or commodity graph.
Table of Contents
Support and Resistance: Spotting Key Decision Zones
The first critical step to understanding the market structure like a pro is plotting key Support and Resistance (S&R) on the chart. The reason is straightforward: the price will often respect, stop, or reverse at these S&R zones. This tends to happen especially when:
- There is confluence of levels at or near a price zone.
- The price is approaching a respected and recent S&R level for the first or even second time.
Traders need to be aware of the major price zones to avoid trading into keys levels and perhaps even be prepared to trade away from those levels (i.e., taking a long at support if higher time frames are in an uptrend).
Key S&R levels can be very diverse, and, ultimately, it's up to each trader to show the preferred tools. Keep in mind that adding too many S&R levels, however, will clutter the chart. Here are a few important examples:
- Round psychological levels, such as 1.10 or 1.25;
- Fibonacci retracements, or target levels;
- Bands like Admiral Keltner or Bollinger Bands;
- Pivot Points like Admiral Markets Pivot Points;
- Other S&R levels like Fractals and moving averages.
Up and Downtrend: Defining the Price Direction
The concept of trend indicates the overall direction of the chart. Is the price moving up, down, or sideways?
The chart is considered to be trending when the price is moving up (bullish) or down (bearish), whereas sideways movement is known as a range, or non-trending chart. Trend is an important aspect of reading the chart as it offers traders the ability to understand which direction is stronger because the trend is likely to continue unless there are visible reversal patterns (see next subsection).
The trend can be best captured by trend channels and a long-term moving average (MA) like 100, 150, or 200 sma, or Fibonacci MAs, such as 89 and 144 ema.
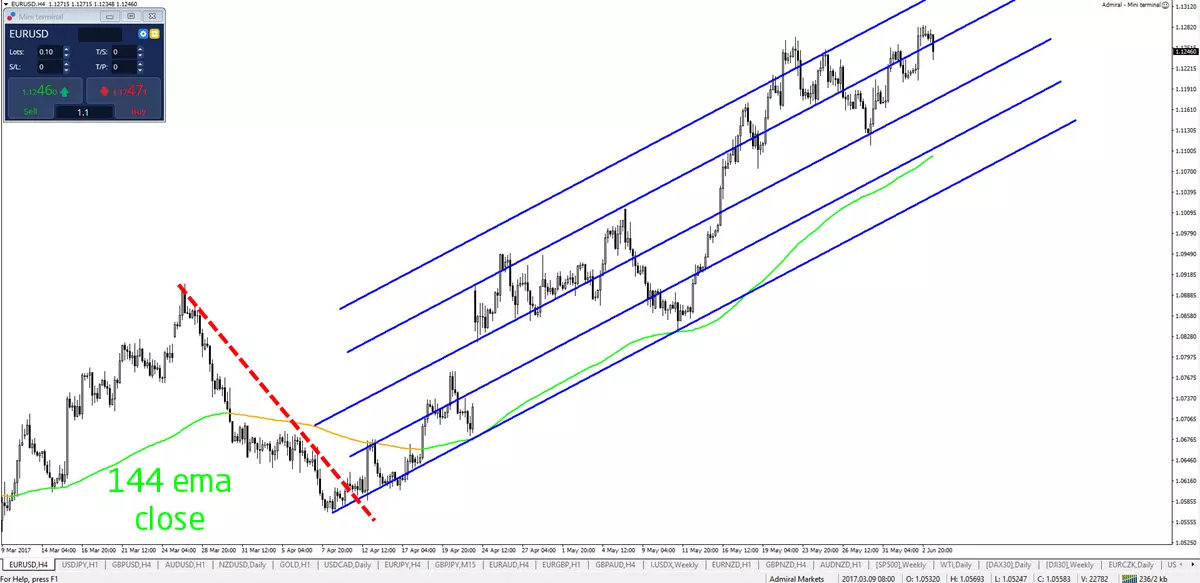
Source: Chart from Admiral Markets MT4 SE-EUR/USD 4h Chart 9 March-5 June 2017
Price Patterns: Understanding the Market Psychology
Patterns are repetitive price movements that provide more information to the trader. They provide more information about potential reversals, trend corrections, trend continuations, ranges, and breaks out of ranges.
For instance, bull flag chart patterns indicate that the price is much more likely to continue with the trend, especially, if the price manages to break flag resistance with strong candlesticks (indicating that the bulls are holding control).
There are many discovered and surely undiscovered patterns for traders to find and use, but be aware of patterns that lack internal logic. For example, expecting a bullish day on the GBP/USD just because your favourite football club won a match on Sunday is probably a random pattern.
Here is a list of some of useful and tested patterns:
- Chart patterns;
- Candlestick patterns;
- Divergence patterns;
- Break, pullback, and continuation patterns;
- Wave patterns.
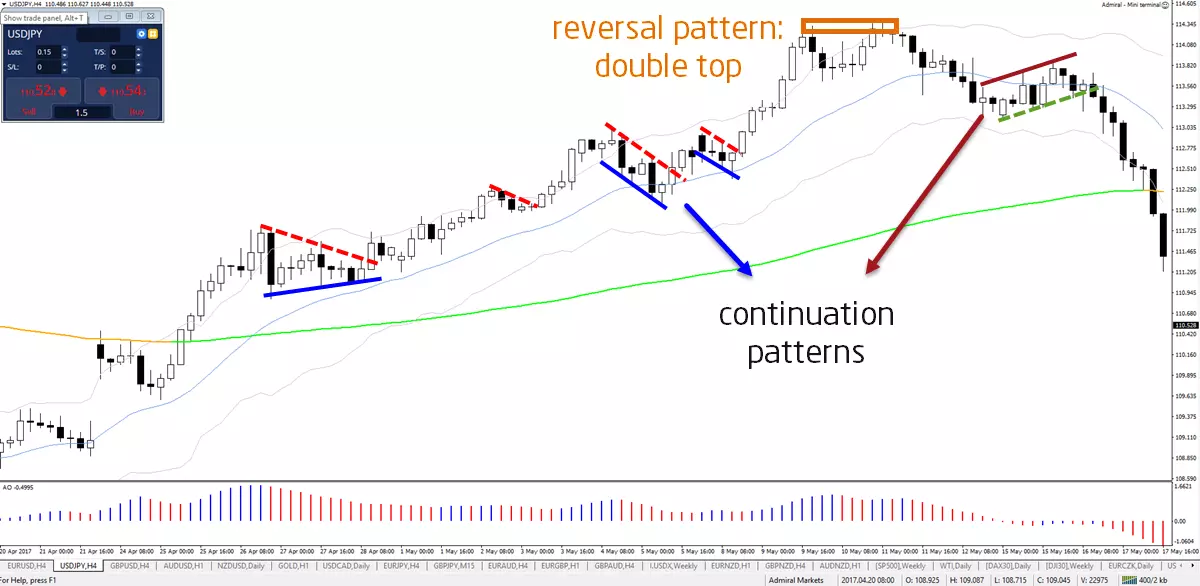
Source: Chart from Admiral Markets MT4 SE-USD/JPY 4h chart 20 April-17 May 2017
The Path of Least Resistance: Utilising the Market Structure
The price flows naturally from one level to another as it chooses the path of least resistance. At each spot, the price could continue with its momentum or respect the support or resistance level. This means that:
- The price will stop at (strong) support or resistance if the momentum is weaker;
- The price will break through support or resistance if the momentum is stronger.
Patterns provide more information about the battle and balance between S&R and momentum. For instance, a continuation chart pattern like a bull flag could indicate that the S&R level might break once the momentum picks up speed again.
Price action follows the same rhythm as the flow of the river down the mountain: water will push aside small rocks, but go around a heavy rock.
Understanding the market structure means understanding the path of least resistance in a more comprehensive way, which is beneficial for both discretionary and system traders. This will allow traders to filter out setups showcasing less potential to succeed and focus on those more prospective ones.
Trade With Admiral Markets
If you're feeling inspired to start trading, or this article has provided some extra insight to your existing trading knowledge, you may be pleased to know that Admirals provides the ability to trade with Forex and CFDs on up to 80+ currencies, with the latest market updates and technical analysis provided for FREE! Click the banner below to open your live account today!

INFORMATION ABOUT ANALYTICAL MATERIALS:
The given data provides additional information regarding all analysis, estimates, prognosis, forecasts, market reviews, weekly outlooks or other similar assessments or information (hereinafter “Analysis”) published on the websites of Admiral Markets investment firms operating under the Admiral Markets and Admirals trademarks (hereinafter “Admirals”). Before making any investment decisions please pay close attention to the following:
1. This is a marketing communication. The content is published for informative purposes only and is in no way to be construed as investment advice or recommendation. It has not been prepared in accordance with legal requirements designed to promote the independence of investment research, and that it is not subject to any prohibition on dealing ahead of the dissemination of investment research.
2. Any investment decision is made by each client alone whereas Admirals shall not be responsible for any loss or damage arising from any such decision, whether or not based on the content.
3. With view to protecting the interests of our clients and the objectivity of the Analysis, Admirals has established relevant internal procedures for prevention and management of conflicts of interest.
4. The Analysis is prepared by an independent analyst (hereinafter “Author”) based on the author's personal estimations.
5. Whilst every reasonable effort is taken to ensure that all sources of the content are reliable and that all information is presented, as much as possible, in an understandable, timely, precise and complete manner, Admirals does not guarantee the accuracy or completeness of any information contained within the Analysis.
6. Any kind of past or modeled performance of financial instruments indicated within the content should not be construed as an express or implied promise, guarantee or implication by Admirals for any future performance. The value of the financial instrument may both increase and decrease and the preservation of the asset value is not guaranteed.
7. Leveraged products (including contracts for difference) are speculative in nature and may result in losses or profit. Before you start trading, please ensure that you fully understand the risks involved.

