The pandemic continues to strengthen the e-commerce sector

Just a few days ago, we were talking about the excellent earnings results from Amazon, Alibaba, and eBay, and yesterday we learned about Shopify results. Again, these also came in better than expected, giving us another good sign of the strength of the e-commerce sector thanks to the Covid-19 pandemic.
Shopify is a Canadian, Ottawa-based company which provides a cloud-based, multichannel commerce platform, primarily focused on small and medium-sized businesses. The businesses are offered the ability to run their shops through all their sales channels, creating not only the possibility of place orders and payments through mobile devices, but also to enhance business relationships with customers.
In its results, we note that the earnings increase per share is $1.58, with total earnings of $977.74 million, versus the expected $1.22 per share increase and earnings of $913.13 million. Currently, the stock is trading around $1,425 per share, so if we analyze it from its earnings per share, we obtain a PER greater than 898, so the net profit is 898 times the share price. This may indicate that shareholders are willing to pay more per share as they expect the company to continue to grow significantly in the future.
Technically speaking, the uptrend in recent months has been clear in this stock and after overcoming the important lateral channel delimited by the green and red bands, the share price has experienced a new upward momentum that has led it to exceed 1,400 dollars per share reached almost all-time high after all-time high.
Currently, it is trading far from its main support levels and we can observe an overbought in its stochastic indicator, although after these good results this action may find a new momentum, so any retracement to its support levels can be seen as a good opportunity for some investors, since as long as it does not lose its main support levels (the trend line, an average of 200, and lower band of the channel in red) the feeling will continue to be bullish.
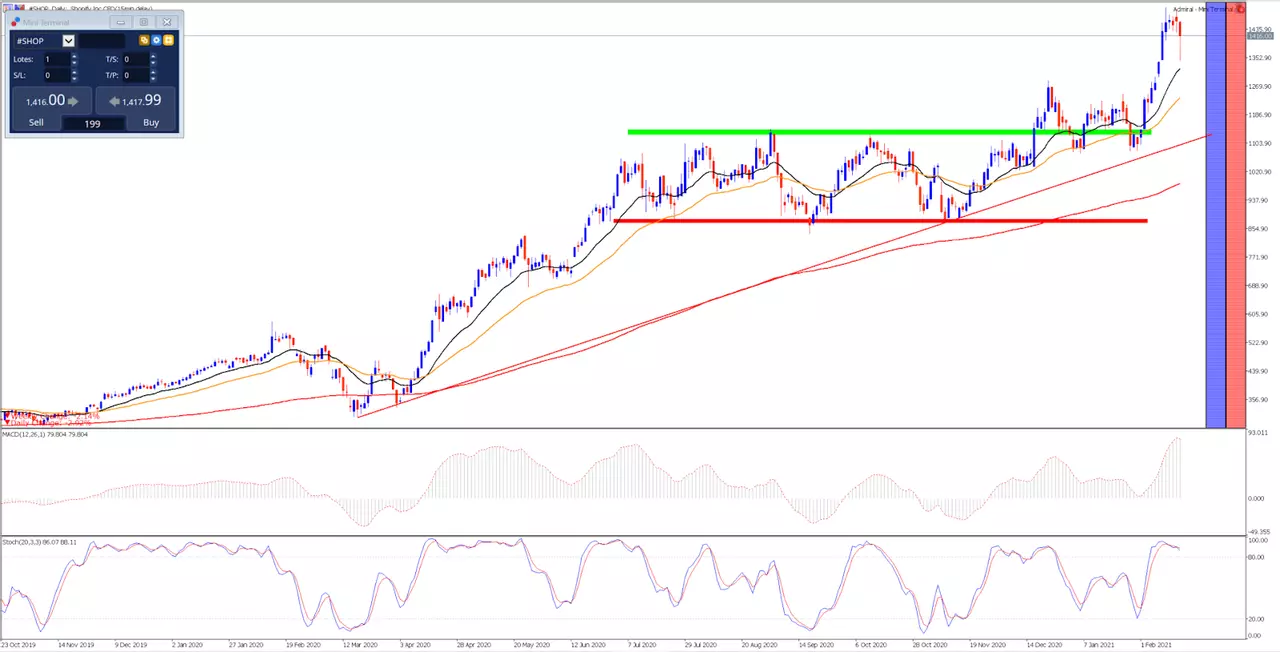
Source: Admiral Markets MetaTrader 5. Shopify daily chart. Data range: from October 23, 2019 to February 18, 2021. Prepared on February 18, 2021 at 12:40 p.m. CET. Keep in mind that past returns do not guarantee future returns.
Price evolution in the last 5 years:
- 2020: 184.71%
- 2019: 187.17%
- 2018: 37.08%
- 2017: 135.60%
- 2016: 66.16%
With the Admiral Markets Trade.MT5 account, you can trade Contracts for Differences (CFDs) of Shopify and more than 3000 stocks! CFDs allow traders to try to profit from the bull and bear markets, as well as the use of leverage. Click on the following banner to open an account today:

INFORMATION ABOUT ANALYTICAL MATERIALS:
The given data provides additional information regarding all analysis, estimates, prognosis, forecasts, market reviews, weekly outlooks or other similar assessments or information (hereinafter “Analysis”) published on the websites of Admiral Markets investment firms operating under the Admiral Markets trademark (hereinafter “Admiral Markets”) Before making any investment decisions please pay close attention to the following:
- This is a marketing communication. The content is published for informative purposes only and is in no way to be construed as investment advice or recommendation. It has not been prepared in accordance with legal requirements designed to promote the independence of investment research, and that it is not subject to any prohibition on dealing ahead of the dissemination of investment research.
- Any investment decision is made by each client alone whereas Admiral Markets shall not be responsible for any loss or damage arising from any such decision, whether or not based on the content.
- With view to protecting the interests of our clients and the objectivity of the Analysis, Admiral Markets has established relevant internal procedures for prevention and management of conflicts of interest.
- The Analysis is prepared by an independent analyst, Roberto Rojas (analyst), (hereinafter “Author”) based on their personal estimations.
- Whilst every reasonable effort is taken to ensure that all sources of the content are reliable and that all information is presented, as much as possible, in an understandable, timely, precise and complete manner, Admiral Markets does not guarantee the accuracy or completeness of any information contained within the Analysis.
- Any kind of past or modeled performance of financial instruments indicated within the content should not be construed as an express or implied promise, guarantee or implication by Admiral Markets for any future performance. The value of the financial instrument may both increase and decrease and the preservation of the asset value is not guaranteed.
- Leveraged products (including contracts for difference) are speculative in nature and may result in losses or profit. Before you start trading, please ensure that you fully understand the risks involved.

